
UV-VISIBLE SPECTROSCOPY
E N D
Presentation Transcript
Contents • History Introduction Principle Beer- Lambert law InstrumentAtion Single beam instrument Double beam instrument Spectrophotometer Factor affecting the accuracy and precision of Spectrometer Advantage and disadvantage Application
History and introduction • History: • In 1953, Bausch & Lomb introduces the SPECTRONIC 20 UV-Vis spectrophotometer, low-cost UV-Vis spectrophotometer. In 1954, Applied Physics Corporation launches the Cary 14 spectrophotometer, the first commercially available double-beam spectrophotometer. Introduction: • Absorption of electromagnetic radiations by the organic molecule in both UV and visible region is based on the same principles and lead to the same type of molecular excitations. • It is therefore discussed together as ultraviolet/visible spectroscopy. It is also termed as electronic spectroscopy because the absorption of UV/visible radiations results in the transitions among the electronic energy levels of the molecules. • The wavelength is usually expressed in nm.
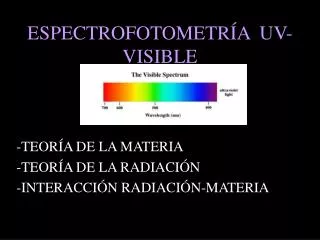
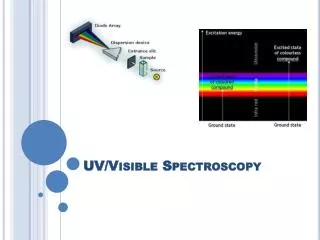
PRINCIPLE OF UV/VISIBLE SPECTROSCOPY “When the radiations ranging from 200-800 nm are passed through the solution of a compound, the electrons within the bonds in the molecules become excited and occupy higher quantum states and in this process they absorb some of the energy.” • The absorbance of the solution increases as the attenuation of beam increases. The more loosely the electrons are held in the bonds of molecules, the longer the wavelength (lower energy) are absorbed. • The greater the number of molecules capable of absorbing light of a given wavelength, the greater the extent of light absorption. Absorbance of light is described by ―Beer-Lambert Law”.
Beer-Lambert Law Statement: “when a beam of monochromatic light is passed through a solution of an absorbing substance, the rate of decrease of intensity of radiation with thickness of the absorbing solution is proportional to the incident radiation as well as the concentration of the solution”. This is due to a) Reflection at the inner and outer surface of the cell. b) Scattering by particles in the solution c) Absorption of light by the molecules in the solution. • The reflection at the cell surfaces can be compensated by the reference cell containing solvent only and scattering may be minimized by filtration of the solution.
Continue…….. Beer-Lambert law is a combination of two different laws: Beer’s law and Lambert law. Beer’s Law: Beer’s was stated by August Beer which states that concentration and absorbance are directly proportional to each other. Lambert Law: J.H Lambert stated Lambert law. It states that absorbance and path length are directly proportional. Beer-Lambert Law Formula absorbance formerly known as optical density (OD) is defined as A = -logT;. (T= IT/Io) A= log (Io/IT ) Where, ITis the intensity Transmitted light Io is the initial intensity Transmittance increases and absorbance decreases
Continue…… Wavelength absorbance is A=abc A combination of these two laws yield the Beer-Lambert Law. A= log (Io/IT ) = abc Where, log (Io/IT ) is also known as absorbance and is represented by A(is a measure of amount of light absorbed by the sample) b= path length of the cell in cm c= concentration of analyte in moles/liters a = molar absorptivity The name and value of a depends on the unit of concentration. When the c is in moles/liters , the constant is called molar absorptivity and has a symbol ε ( Greek letter epsilon) the equation therefore takes the form: A= ε bc
INSTRUMENTATION • Spectrophotometer It is an instrument which is used to study the absorption and emission of a radiation as a function of wavelength is called spectrophotometer. There are many variations depending on. • Manufacturer. • Wavelength regions for which instrument is designed. • Need of application. Type of Spectrophotometer Based upon construction two types. 1. Single beam spectrophotometer 2. Double beam spectrophotometer 3. Simultaneous spectroPhotometer • Single Beam spectrophotometer includes a monochromator between the light source and specimen. The specimen is analysed individually for all wavelengths.
Continue • Double beam spectrometer uses a single light source, monochromator, a splitter and a series of mirrors, to direct the beam towards the reference and the sample under investigation. • Simultaneous spespectroPhotometer uses an array of diodes for simultaneous detection of absorbance at all wavelengths. This is the fastest and most efficient of the three.
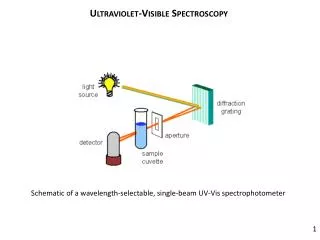
Instrumentation • The basic components of a spectrometer include: light source (UV and visible), monochromator (wavelength selector),sample stage, and detector. • Some common components to all types are light source, holders and detector. Light source: UV Source: Continuous UV spectrum is produced by electrically exciting deuterium or hydrogen at low pressures. The emission wavelengths of both deuterium and hydrogen lamps are in 160 to 375 nm range. Visible Light Source: Tungsten filament lamp is used as visible light source. This lamp can produce light in 350 to 2500 nm wavelength range Filter: It may be used, in addition, to select one wavelength at a time. This filter is often termed as the monochromator.The main components of Monochromator are: a) Entrance slit b) Collimating lens c) Prism or dispensing element d) Focusing lens e) Exit slit.
Continue Sample device/Cuvettes: Cuvettes are small vials that may be made from glass, quartz or plastic and used for analysis with a spectrometer, fluorometer or spectrophotometer. The high degree of clarity and square shape allow for light to pass through the sample and produce readings with the instrument. Detectors: Detector response in a function of wavelength of incident light. i.e. A detector produces an electric signals when struck by photons. Types of detector Following are the common types of detectors a) Photo tube detector b) Photomultiplier tube c) silicone photo diode d) Barrier layer cell Photo tube photo multiplayer
Graph: UV-visible spectrum of acetaminophen in SGF at pH 1.2
Application There are some application • Detection of Impurities Structure elucidation of organic compounds. Quantitative analysis Qualitative analysis Chemical kinetics Detection of Functional Groups Quantitative analysis of pharmaceutical substances. Examination of Polynuclear Hydrocarbons Molecular weight determination As HPLC detector
FACTORS AFFECTING ACCURACY AND PRECISION OF SPECTROPHOTOMETER Accuracy and precision depends on three major factors. • strumental factor. • Chemical factor. • Operator skill. • Chemical variables: These are determined by: • Purity of sample solution • Effect of solvent • Chromophore • Condition of equilibrium • Operator skill: Finally operator skill can obviously contribute greatly to the degree of accuracy and precision.
Advantages: • Inexpensive instrument Wavelength can be selected Ease of operation due to simplicity in its structure Disadvantage: • Only those molecules are analyzed which have chromophores The results of the absorption can be affected by pH, temperature, contaminants, and impurities. Only liquid samples are possible to analyze It takes time to get ready to use it.