Download
1 / 45
470 likes | 671 Views
UV-VISIBLE MEASUREMENTS. WHAT CAN WE RETRIEVE IN THE UV-VISIBLE?. Most easily retrieved (strongest features): O 3 (~300 n m), NO 2 (~300-500 nm), H 2 O (>500 nm) HCHO (250-350 nm) ClO (250-300 nm) BrO (300-380 nm) SO 2 (250-320 nm). [Gottwald et al., The SCIAMACHY Book, 2006].

E N D
WHAT CAN WE RETRIEVE IN THE UV-VISIBLE? Most easily retrieved (strongest features): O3 (~300 nm), NO2(~300-500 nm), H2O(>500 nm) HCHO (250-350 nm) ClO (250-300 nm) BrO (300-380 nm) SO2(250-320 nm) [Gottwald et al., The SCIAMACHY Book, 2006]
DIFFERENCES BETWEEN UV-VISIBLE AND IR RETRIEVALS • Atmospheric Scattering must now be considered • There is no emission from the atmosphere • no vertical information from emission at different T, therefore total columns ONLY* • Absorption cross-sections generally extend across larger wavelength regions, unlike strong IR features In general, UV-visible retrievals are “physical retrievals” and do not employ optimal estimation* *exception = tropospheric ozone
UV-VISIBLE RETRIEVALS ARE A 2-STEP* PROCESS • From spectra estimate a slant column(S) • Two common approaches employed: • Direct Spectral Fitting • DOAS (Differential Optical Absorption Spectroscopy) • 2. Translate from slant column to vertical column () • Slant column depends on the location of the sun and the satellite and therefore the light path length is variable! Need to translate to some geophysical quantity that’s useful. But it’s not just geometry… Vertical Column Slant Column (along light path) AMF=air mass factor * There can be additional steps (corrections, considerations), depending on the species
DIRECT SPECTRAL FITTING REFERENCE SPECTRA + TEMPERATURE DEPENDENCE LEAST SQUARES FITTING MEASURED SPECTRA SLANT COLUMN OF [X] Example: direct fit of GOME backscattered spectrum in 338-356 nm HCHO band [HCHO]=3.0x10¹⁶ molecules/cm2 Chance et al. [2000]
DIFFERENTIAL OPTICAL ABSORPTION SPECTROSCOPY Use multiple wavelengths to characterize optical absorption of a species. Separate slowly moving component (io) from rapidly moving component (i’): C=concentration L=light-path length =absorption cross-section RRaleigh extinction MMie extinction Io’=intensity in absence of differential absorber Differential optical density: DOAS requires species with reasonably narrow absorption features
AIR MASS FACTORS (AMF) Air mass factor (AMF) depends on the viewing geometry, the scattering properties of the atmosphere, and the vertical distribution of the absorber Requires an Radiative Transfer model and a Chemical Transport Model (CTM) w(z): satellite sensitivity (“scattering weight”), determined from radiative transfer model including clouds and aerosols S(z): normalized mixing ratio (“shape factor”) from CTM AMFG: geometric air mass factor (no scatter) Accounting for scattering weights is far less important for stratospheric species (eg. BrO in the stratosphere) Palmer et al., 2001
GEOMETRIC AIR MASS FACTOR dv SZA=solar zenith angle v=satellite viewing angle d1 d2 v SZA Slant distance = d1+d2 = dv/cos(SZA)+dv/cos(v) = dv [sec(SZA)+sec (v) ] AMFG=d/dv = sec(SZA)+sec(v) Values of the geometric air mass factor typically ~ 2-2.5 Vertical column is ~ ½ of slant column purely from geometry
AMF FORMULATION FOR A SCATTERING ATMOSPHERE Account for vertical instrument sensitivity (scattering increases towards the surface, inhibits the view of the lower atmosphere) + how this is convolved with the distribution of species X Example from GOME formaldehyde (HCHO) measurements what GOME sees GOME sensitivity w() HCHO mixing ratio profile S() (GEOS-Chem) AMFG = 2.08 actual AMF = 0.71 Palmer et al., 2001
WHAT ARE AMFs SENSITIVE TO? Scattering weights are most sensitive to the surface albedo and aerosol loading Palmer et al., 2001 • Increasing A allows more solar radiation into the lower atmosphere = increasing observational sensitivity • Relatively insensitive to angle between sun & satellite (E): with larger angle physical path increase (AMFG larger) but scattering along the path reduces the sensitivity • Aerosols increase the sensitivity to HCHO in this example: increasing AOD from 0.1 to 1.0 (typical range) increases AMF by 30% Scattering decreases the sensitivity to species AMF is typically ½ AMFG
HOW VARIABLE ARE AMFs? If most of the species X is in the BL, where the instrument is not as sensitive, the AMF will be lower to compensate ocean AMFs are higher than over land Continuing with our HCHO example… Also see particularly low AMFs in California due to shallow BL Given this variability, it is inappropriate to use single S(z) for tropospheric species Palmer et al., 2001 * We should all be grateful that journals no longer charge for on-line colour
RETRIEVAL CONSIDERATIONS • CLOUDS: Cloud droplets scatter radiation and complicate the interpretation… • Generally try to filter for < 40% cloudy conditions to ensure higher quality retrievals • 2. AEROSOLS: Important sensitivity to aerosols means it’s important to include these in the scattering weight calculations. • 3. ARTIFACTS: GOME solar diffuser plate bias: daily varying global bias – tricky correction! • 4. STRATOSPHERIC CONTRIBUTION: For species with significant part of the column in the stratosphere, must develop a technique to remove this contribution. • 4. SHAPE FACTOR: continual improvement of shape factors from model. Also shape factors may vary at spatial scales higher than represented by models…
THE ROLE OF CLOUDS Clouds enhance sensitivity to species above clouds and reduce (obscure) sensitivity for below cloud Early retrievals tried to limit cloud contamination by keeping Fcloud<40% Later techniques: more sophisticated approach to separately estimate AMF for cloudy & clear scenes and combine based on cloud fraction a=clear-sky c=cloudy R=reflectivity f=cloud fraction • Advantages: • correct cloud effects on backscatter • (2) retrieve in partly cloud scenes Martin et al., 2002
VARIABILITY OF AMFs and CLOUDS AMFc>AMFa when little NO2 is below the cloud (oceans) AMFc<AMFa when cloud obscures BL NO2 (land) July AMFs for NO2 Clear-sky AMFs Actual AMFs (accounting for clouds) Note high spatial variability in the cloud correction Martin et al., 2002
STRATOSPHERIC CONTRIBUTION MUST BE REMOVED FOR SOME SPECIES…. Significant fraction of the column is in the stratosphere (note poleward increase) • General approach: • Pick low-tropospheric NO2 region Pacific • * If assume NOtropospheric contribution here might remove too much! • Assume the stratospheric contribution is longitudinally invariant • Subtract stratospheric contribution from total slant column
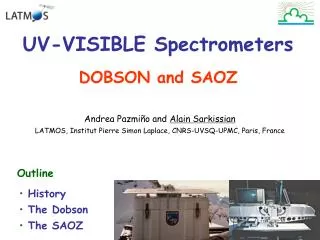
ATMOSPHERIC MEASUREMENTS FROM UV-VISIBLE 1978 1995 2002 2005 2007 TOMS/ Nimbus 7 (78-94) Meteor-3 (78-94) ADEOS (96) EP (96-06) GOME/ERS-2 SCIMACHY/ENVISAT OMI/AURA O3, NO2, HCHO, BrO, OClO, H2O, SO2 Daily Global coverage UV-vis O3, NO2, HCHO, BrO, OClO, H2O, SO2 Global coverage 3 days UV-vis O3, NO2, HCHO, BrO, OClO, H2O, SO2, CO, CH4 Global coverage 3 days UV-vis-near IR Total O3 (derived tropospheric column), AI, SO2 Global coverage ~daily UV-vis GOME-2/ METOP-A
TOTAL OZONE MAPPING SPECTROMETER(1979-2006) Launched onboard several platforms, last in the series was EP-TOMS (NASA) 1 day of data • EP-TOMS HORIZONTAL COVERAGE: • 39 km x 39 km nadir footprint with 1365 km cross-track scanning • Global coverage ~ daily • EP-TOMS OVERPASS TIME: • ~11:16 equator cross-over
TOMS INSTRUMENT 1979-2006 Harrtley band Chappuis band Huggins band PRODUCTS: O3 column Aerosol Index UV radiance SO2 • MEASUREMENT TECHNIQUE: • Monochromator (SBUV) • 6 wavelength bands (309, 313, 317, 322, 331, 360 nm)
GLOBAL OZONE MONITORING EXPERIMENT (GOME) Launched Apr. 1995 1 day of data Launched onboard ERS-2 (ESA) • HORIZONTAL COVERAGE: • 40 km x 320 km nadir footprint with 960 km cross-track scanning (GOME-2 40 km x80 km) • Global coverage in ~3 days (GOME-2 ~1day+) • OVERPASS TIME: • ~10:30 equator cross-over (note only daytime in UV-visible provides useful data)
GOME INSTRUMENT Launched Apr. 1995 GOME-2 PRODUCTS: O3 (column & profile) NO2 HCHO BrO OClO H2O SO2 • MEASUREMENT TECHNIQUE: • Scanning Spectrometer • Spectral range: 240-790 nm (covered in 4 channels) • Spectral resolution: 0.2-0.4nm
SCANNING IMAGING ABSORPTION SPECTROMETER FOR ATMOSPHERIC CARTOGRAPHY(SCIAMACHY) Launched Mar 2002 Launched onboard Envisat (ESA) 1 day of data • HORIZONTAL COVERAGE: • 30 km x 60 km nadir footprint with 1000 km cross-track scanning • Global coverage in ~3 days • OVERPASS TIME: • ~10:00 equator cross-over
SCIAMACHY INSTRUMENT Launched Mar 2002 • MEASUREMENT TECHNIQUE: • Imaging Spectrometer (very similar to GOME) • Spectral range: 240-314, 309-3405, 394-620, 604-805, 785-1050, 1000-1750, 1940-2040 and 2265-2380nm • Spectral resolution: 0.2-1.5nm
THREE VIEWING GEOMTRIES FOR SCIAMACHY • Nadir • Limb • Solar occultation
OZONE MONITORING INSTRUMENT (OMI) Launched July 2004 Launched onboard EOS-Aura (NASA) 1 day of data • HORIZONTAL COVERAGE: • 13 km x 24 km nadir footprint with 2600 km cross-track scanning • Daily Global coverage • OVERPASS TIME: • ~13:30 equator cross-over Reduced pixel size is a big advantage! (less cloud contamination)
OMI INSTRUMENT Launched July 2004 PRODUCTS: O3 (column & profile) NO2 HCHO BrO OClO H2O SO2 • MEASUREMENT TECHNIQUE: • Imaging spectrometer (CCD detector) • Spectral range: 270-314nm, 306-380nm, 350-500nm • Spectral resolution: 0.45-1.0nm
EFFECT OF SPATIAL RESOLUTION ON TROPOSPHERIC MEASUREMENTS Even at SCIAMACHY spatial resolution details are lost Courtesy: Andreas Richter * OMI is 13x24 km2 GOME-2 is 80x40 km2
MAPPING OF NOx EMISSIONS FROM SPACEusing measurements of tropospheric NO2 columns satellite validation spirals 420 nm OMI instrument March 2006 NASA INTEX-B aircraft mission NO NO2 NOx is mainly from fossil fuel combustion; limiting precursor for ozone formation Boersma et al. [2008]
TROPOSPHERIC NO2 RETRIEVAL • Data analysis: • Cloud screening • DOAS retrieval of total slant columns • Subtraction of clean Pacific sector to derive tropospheric slant columns • Application of tropospheric airmass factor to compute tropospheric vertical column
ERROR ANALYSIS FOR TROPOSPHERIC NO2 min error [Martin et al., 2002]
HIGHER SPATIAL RESOLUTION FROM SCIAMACHY Launched in March 2002 aboard Envisat 60x30 km2 320x40 km2 Potential for finer resolution of sources, but need to account for transport
TROPOSPHERIC NO2 FROM OMI October 2004 K. Folkert Boersma (KNMI)
NOX MEASUREMENTS REVEAL TRENDS IN DOMESTIC EMISSIONS NO2 emissions in US, EU and Japan decline … while emissions growing in China East-Central China Importance of long-term record! Richter et al., 2005; Fishman et al., 2008
MEASUREMENT OF NO2 SHIPPING EMISSIONS FROM SCIAMACHY • Ship emissions: • large source of NOx, SOx and aerosols • relevant input into marine boundary layer • well defined NO2-patterns in Red Sea and Indian Ocean in SCIAMACHY data • consistent with pattern of shipping emissions Courtesy: Andreas Richter
MAPPING OF REACTIVE HYDROCARBON EMISSIONS FROM SPACEusing measurements of formaldehyde columns 340 nm hydro- carbons formaldehyde Biogenic isoprene is the main reactive hydrocarbon precursor of ozone …and a major source of organic particles Millet et al. [2008]
FITTING OF HCHO SLANT COLUMNS FROM GOME SPECTRA ts = 1.0 ± 0.3 x1016 cm-2 Fitting uncertainty of 4x10¹⁵ molecules cm-3 corresponds to ~ 1 ppbv HCHO in lowest 2 km ts = 3.0 ± 0.4 x1016 cm-2 ts = 8.4 ± 0.7 x1016 cm-2 Chance et al. [2000]
FORMALDEHYDE COLUMNS MEASURED BY GOME (JULY 1996) 2.5x10¹⁶ molecules cm-2 2 1.5 1 detection limit 0.5 South Atlantic Anomaly (disregard) 0 -0.5 High HCHO regions reflect VOC emissions from fires, biosphere, human activity
SEASONALVARIATION OF GOME FORMALDEHYDE COLUMNS reflects seasonal variation of biogenic isoprene emissions GOME GEOS-Chem (GEIA) GOME GEOS-Chem (GEIA) MAR JUL APR AUG SEP MAY JUN OCT Abbot et al. [2003]
A NEEDLE IN A HAYSTACK: DERIVING TROPOSPHERIC OZONE FROM TOMS • Issues: • high uncertainty • seasonal averages only • does not extend to high latitudes [Fishman and Larson, 1987; Fishman et al., 2008]
TROPOSPHERIC OZONE OBSERVED FROM SPACE Optimal estimation (MAP) also used for retrievals of ozone profiles in the UV-vis IR emission measurement from TES UV backscatter measurement from GOME GOME JJA 1997 tropospheric columns (Dobson Units) Zhang et al., 2006 Liu et al., 2006
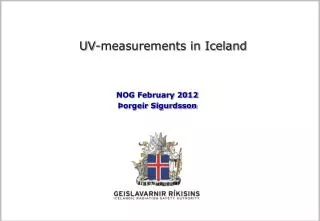
TOMS: SO2 MEASUREMENTS SO2 has an absorption band in one of the TOMS channels (which can interfere with the ozone retrieval) If concentrations are high enough SO2 can be retrieved Example: volcanic eruptions such as Mount Hekla (Iceland) on Feb 27, 2000 http://toms.umbc.edu/archives.html Courtesy: Andreas Richter
GOME: TROPOSPHERIC BrO IN THE ANTARCTIC GOME BrO Sep. 7 - 9, 1996 Low ozone events in Arctic and Antaractic Spring are correlated with high BrO in the BL (catalytic cycle for ozone destruction = parallel to strat chemistry) [Wagner and Platt, 1999] GOME data provided the first information of the spatial and temporal distribution of polar springtime BrO Courtesy: Andreas Richter
GLYOXAL COLUMNS: WHAT DO THEY MEAN? SCIAMACHY data suggest a large marine source of glyoxal (not seen in models) [Wittrock et al., 2006]
First measurements of vertical column of CO with sensitivity down to the surface. Unfortunately long averaging times required to combat noisy retrievals. SCIAMACHY RETRIEVALS OF CO [Buchwitz et al., 2007]
Retrieve column averaged mixing ratios, denoted XCH4 and XCO2. They are computed by normalizing the measured greenhouse gas columns by the measured total airmass (number of air molecules per cm2) obtained from, e.g., simultaneously measured O2 columns. NEAR-IR CLIMATE GAS RETRIEVALS: SCIAMACHY Clearly visible are major methane source regions such as wetlands (e.g. Siberia, tropics) and rice fields (e.g. China) Northern hemispheric carbon dioxide during March-June, where CO2 is relatively high mainly due to release of CO2 to the atmosphere by decaying vegetation, and July-October, where CO2 is relatively low mainly due to uptake of atmospheric CO2 by growing vegetation [Buchwitz et al., 2007]