Download
1 / 10
100 likes | 363 Views
Advanced Higher Chemistry Unit 1 UV and visible spectroscopy. Transition metal compounds. The effects of d-d transitions can be studied using ultra-violet and visible spectroscopy.

E N D
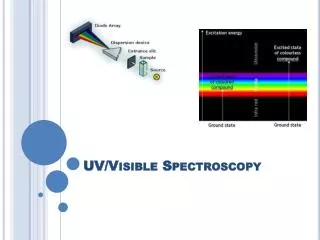
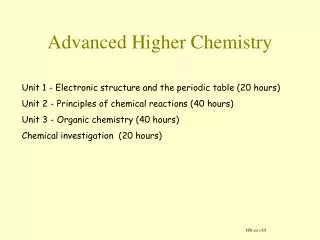
Advanced Higher Chemistry Unit 1 UV and visible spectroscopy
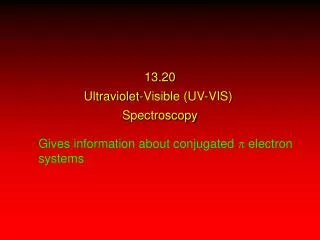
Transition metal compounds • The effects of d-d transitions can be studied using ultra-violet and visible spectroscopy. • Absorption of energy in these regions of the spectrum causes transitions of electrons between energy levels in atoms, molecules and ions.
UV has a wavelength range of approximately 200 – 400nm. • The visible spectrum has a wavelength range of approximately 400 – 700nm. • UV has a shorter wavelength and hence, higher energy than visible radiation so the difference between the energy levels is greater when UV radiation is absorbed.
If a transition metal compound absorbs radiation from the visible spectrum the compound will often be coloured. • If a transition metal compound absorbs radiation from the UV spectrum it will appear colourless.
Samples are used in solution and are placed in a cell. • Another identical cell containing the pure solvent is also placed in the machine. • Radiation across the whole UV or visible range is scanned through the aqueous sample and the pure solvent. • The spectrometer then compares the two beams
The difference is the light absorbed by the aqueous sample. • This data is produced as a chart of wavelength against absorbance e.g.
From the position of the main peak it is possible to calculate the wavelength of the absorption and hence the difference between the energy levels. • In the previous graph it can be seen that the sample absorbs mainly green light hence the solution will be purple. • The height of the peak can be used to calculate the concentration of the absorbing species making spectroscopy a very useful analytical tool.
Video • Watch the RSC video ‘Modern Chemical Techniques’
Exercise • Explanation of Colour in Transition Metal Compounds • You are now able to complete Unit 1 PPA 1