Download
1 / 26
260 likes | 414 Views
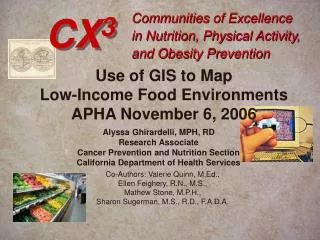
Communities of Excellence in Nutrition, Physical Activity, and Obesity Prevention (CX 3 ):. Using GIS Mapping in Low-Income Neighborhood Food Environments. APHA- Philadelphia, PA November 10, 2009. Presented by:. Alyssa Ghirardelli, MPH, RD.

E N D
Communities of Excellence in Nutrition, Physical Activity, and Obesity Prevention (CX3): Using GIS Mapping in Low-Income Neighborhood Food Environments APHA- Philadelphia, PA November 10, 2009 Presented by: Alyssa Ghirardelli, MPH, RD Additional contributors: Valerie Quinn, MEd., Sharon Sugerman, MS, RD, Matthew Stone, MPH This material was produced by the California Department of Public Health, Network for a Healthy California, with funding from the USDA Supplemental Nutrition Assistance Program (formerly the Food Stamp Program). This material was produced by the California Department of Public Health, Network for a Healthy California, with funding from the USDA Supplemental Nutrition Assistance Program (formerly the Food Stamp Program). These institutions are equal opportunity providers and employers. In California, food stamps provide assistance to low-income households, and can help buy nutritious foods for better health. For food stamp information, call 877-847-3663. For important nutrition information visit www.cachampionsforchange.net. This material was produced by the California Department of Public Health, Network for a Healthy California, with funding from the USDA Supplemental Nutrition Assistance Program (formerly the Food Stamp Program). These institutions are equal opportunity providers and employers. In California, food stamps provide assistance to low-income households, and can help buy nutritious foods for better health. For food stamp information, call 877-847-3663. For important nutrition information visit www.cachampionsforchange.net. This material was produced by the California Department of Public Health, Network for a Healthy California, with funding from the USDA Supplemental Nutrition Assistance Program (formerly the Food Stamp Program). These institutions are equal opportunity providers and employers. In California, food stamps provide assistance to low-income households, and can help buy nutritious foods for better health. For food stamp information, call 877-847-3663. For important nutrition information visit www.cachampionsforchange.net.
Presenter Disclosures Alyssa Ghirardelli, MPH, RD (1) The following personal financial relationships with commercial interests relevant to this presentation existed during the past 12 months: No relationships to disclose
CX3: Communities of Excellencein Nutrition, Physical Activity and Obesity Prevention • Documents the physical environment and empowers local action to change conditions to support individual behaviors • A planning model that involves assessing communities in relation to a variety of obesity prevention benchmarks known as community indicators and assets • Activate consumers and partners to improve food availability in low-income neighborhoods • 3= nutrition, physical activity and obesity prevention
CX3:Use of On-line Network GIS Map Viewerhttp://www.cnngis.org
CX3 Data (Cont.) Field Surveys
CX3 Sites 23 Network funded Local Health Departments All types: Urban dense, suburban, rural, remote More w/ other funding, including CA Regional Obesity Prevention Projects
CX3 Neighborhood Selection • 3-7 low-income neighborhoods • Each neighborhood comprised of • 1-5 census tracts • > 50% of population in census tract at or below 185% Federal Poverty Level (FPL) • Other selection factors • Established partnerships • Race/Ethnic make-up • Rural and Urban (for some sites) • Obesity rates (used by one site)
CX3Supermarket Access • Total number of residents served by supermarkets or large grocery stores ( > 20 employees and accounting for any overlap of markets) • Estimated percent of neighborhood residents served and not served within ½ mile buffer of supermarkets or large grocery stores • If no supermarket or large grocery store, approximate distance required to travel to supermarkets for most residents (2/3 or more)
Access to Supermarkets and large grocery ½ mile buffer
CX3Supermarket Access Transit • Proportion of supermarkets or large grocery stores (> 20 emp) with convenient public transit • Supermarket or large grocery store has a stop within 1 block • Frequency: No less than 30 minutes each way including evenings and weekends • Route access through residential areas • If no market in the neighborhood, expand search with buffer • Urban or older/denser suburb—2 miles • Newer suburb—5 miles • Rural—15 miles
Rte. 51 Rte. 83
CX3 Markets Around Schools • Number of small markets and convenience stores within ½ mile of schools • Proportion of schools with small markets and convenience stores within ½ mile • Highest number of small markets and convenience stores for a school within ½ mile (ie. worst case scenario)
Small markets and convenience around schools ½ mile buffer
CX3Farmers’ Markets • Number of farmers markets in the neighborhood and if accept EBT, WIC, Senior Vouchers • If no farmers markets in neighborhood, number within 5 miles • If they accept EBT, WIC, Senior Vouchers • If have convenient public transit
CX3 Fast Food Outlets • Ratios of fast food to population • Fast Food Chain, Non-Chain, Pizza, Sandwich/Deli • Number of outlets within 1000 ft and ½ mile to schools and parks in neighborhood • Proportion of schools/parks with fast food outlets within 1000 ft and ½ mile • Highest number of outlets for a school/park with fast food within 1000 ft and ½ mile (ie. worst case scenario)
Fast food around schools & parks ½ mile buffer
CX3 Aggregated Datasets • 18 Local Health Departments • 73 Neighborhoods • Supermarket Access & Transit • Farmers Markets • Fast Food • 52 Neighborhoods • Small Markets and Convenience Stores around 133 Schools • Most neighborhoods defined by 1-2 census tracts, maximum of 5
CX3 Findings- Supermarket Access • 31% neighborhoods had no supermarket within census tract boundaries • 42% reported most residents had access to supermarket within ½ mile • 74% access within 1 mile • Mean distance for most residents to get to supermarket .88 miles (removing 17 mile rural outlier) • 63% lacked convenient public transit
CX3 Findings- Stores Around Schools n = 52 neighborhoods
CX3 Findings- Farmers’ Markets • 76% no farmers’ market (FM) in the neighborhood • In the 18 neighborhoods with a FM, • 78% accept EBT (Electronic Benefits Transfer- aka. Food Stamps or Supplemental Nutrition Assistance Program), WIC or Senior Vouchers • For those with no FM in neighborhood, • 36% had 1-2 w/in 5 miles • 50% had 3 or more w/in 5 miles • 66% had convenient public transit to market w/in 5 miles • 13% had no farmers’ market within 5 miles
CX3 Findings- Fast Food Neighborhood • Only 4 had no fast food • 12% 15 or more • One neighborhood with 30 in 2 census tracts • Mean ratio of outlets to population 1:1,608 • Worst of 1:202 n = 73 neighborhoods
CX3 Findings- Fast Food Around Schools • 1000 ft (approx. 2 blocks) • 49% neighborhoods had no fast food • 30% neighborhoods had 1-2 fast food • ½ Mile • only 11% had none • 22% 10+ • Mean of 6 fast food
CX3Use of GIS Maps • Maps rated as very useful by local health departments • Locals describe power of maps combined with local level data and photos • Provide visual description of relationships between food sources, community residents and other neighborhood infrastructure • Give initial view to make decisions for dedicating resources, education and action in neighborhoods
Issues – Gaps & Opportunities • Drawing boundaries to fit natural neighborhoods • Crime/safety data • (not city, neighborhood level) • Public transportation routes • Accuracy of GIS retail databases • Resolution of maps • Snapshot in time- conditions change quickly
Thank you! Alyssa Ghirardelli, MPH, RD Research Scientist Network for a Healthy California CA Dept. of Public Health Alyssa.Ghirardelli@cdph.ca.gov 916-449-5342