Download
1 / 15
150 likes | 252 Views
Explore the state of solar energy in the U.S., including key data, market trends, and future projections. Learn about solar technologies, installation trends, and incentives driving growth in the industry. Discover the impact of solar on the energy landscape and explore opportunities for workforce development, financing, and ownership models. Stay informed about the increasing capacity of solar power plants, annual installations, and the evolving policies shaping the solar energy market in the U.S. Embrace the potential for continued growth in solar energy and its role in sustainable energy development.

E N D
“State of Solar” Energy in the U.S. Kathy Jack Environmental Science University of North Texas October 4, 2014 http://www.hdpaperwall.com/sunlight/
Solar Energy Technologies http://solartribune.com Jarlanbah EcoVillage, Nimbin, Australia. Red Oak Subdivtision. Boulder,CO. http://www.lighthousesolar.com/ Soalr One, Barstow, CA. http://solartribune.com/solar-power-plants/
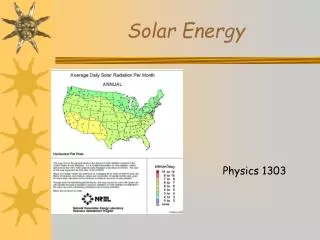
U.S. Primary Energy Consumption by Source (2000-2013) .06% .1% .3% Solaras % total .03% U.S. Energy Information Administration. Monthly Energy Review. September 2014. http://www.eia.gov/totalenergy/data/monthly/#summary
Cumulative Solar by Technology (2013) 11.74 GW AC .4% total U.S. electricity Interstate Renewable Energy Council (IREC).U.S. Solar Market Trends 2013 (2014); GWDCderated by 13.% as recommended by Larry Sherwood, IREC (Oct 2014).
New Electric Generation by Technology 2012 2013 PTC was slated to end 12/12, but extended by American Taxpayer Relief Act 0f 2012 USEIA and IREC in U.S. Solar Market Trends 2012. 2013:5 and U.S. Solar Market Trends 2013, 2014: 6.
Cumulative Installed GPV in U.S. 82% of cumulative GPV installed in last 3 years! Interstate Renewable Energy Council (IREC).U.S. Solar Market Trends 2013 (2014:8).
Annual Installed GPV by Sector (2003-2012) Interstate Renewable Energy Council (IREC).U.S. Solar Market Trends 2012. 2013: 12.
Annual Installed GPV by Sector (2009-2013) 34% increase Total 47% increase in utility 92% PPA 8% decrease 68% increase in residential Increase in leases Interstate Renewable Energy Council (IREC).U.S. Solar Market Trends 2013. 2014: 12
Top 10 States - Annual PV Installation Capacity Interstate Renewable Energy Council (IREC).U.S. Solar Market Trends 2013 (2014:17).
PV Leases - California Source: U.S. Energy Information Administration, based on California Solar Initiative data at USEI, http://www.eia.gov/todayinenergy/detail.cfm?id=12991.
538 utility or gov.rebates • Workforce development • Financing • Ownership models Trends/Drivers EPA 2005 E.R.S.A 2008 A.R.R.A 2009 RPS- 37 33 A’s/B’s Net Metering 26 12 RPS- 20 A’s/B’s Interconnection 2 Installed Cost- LBNL Tracking the Sun VII; Annual Installed PV Capacity- IREC Solar Market Trends 2013; Freeing the Grid:http://freeingthegrid.org/; WRI Bottom Line on Renewable Energy Tax Credits: http://www.wri.org/publication/bottom-line-renewable-energy-tax-credits
Installed Cost of PV 44% in 4 years 11% LBNL. Tracking the Sun VII (2014). http://www.pvsolarreport.com/lbnl-report-shows-decreasing-soft-costs-of-solar/
Annual Installed CPS in U.S. (2009-2013) GW DC 900 800 700 600 500 400 300 200 100 0 The most CSP capacity ever installed in U.S. in a single year 3 new CSP plants 2009 2010 2011 2012 2013 2009
On the Horizon • Continued work on Soft Costs • Continued Growth expected • Grid Saturation • Technical • Loss revenue
Key Sources • Interstate Renewable Energy Council (IREC). • www.irec.com • U.S. Solar Market Trends 2013. (also 2009-20012) • Database for State Incentives for Renewables and Efficiency (DSIRE). IREC, USDOE, NCSC. • http://www.dsireusa.org/ • U.S. Energy Information Administration. • www.eia.gov • Monthly Energy Review. • Freeing the Grid: http://freeingthegrid.org/