Download
1 / 13
130 likes | 150 Views
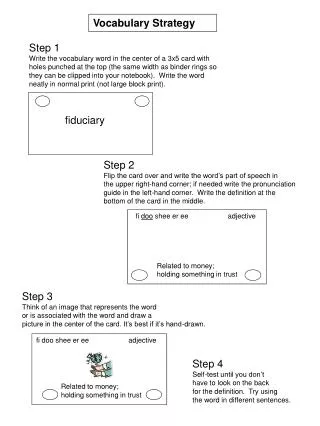
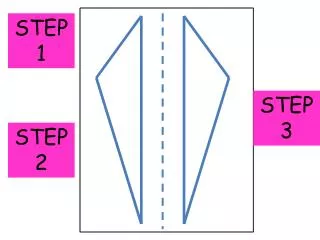
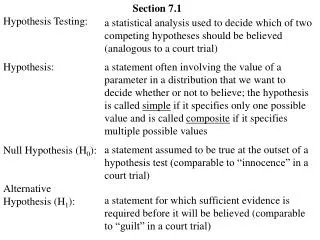
Step-by-step approach for hypothesis testing: state null and alternative hypotheses, choose significance level and sample size, determine test statistics and critical values, collect data, make decision based on statistical results. Real-world examples and exercises included.

E N D
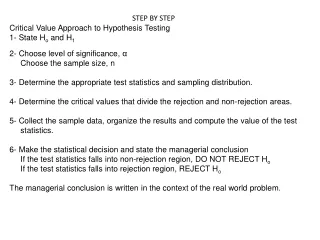
STEP BY STEP Critical Value Approach to Hypothesis Testing 1- State Ho and H1 2- Choose level of significance, α Choose the sample size, n 3- Determine the appropriate test statistics and sampling distribution. 4- Determine the critical values that divide the rejection and non-rejection areas. 5- Collect the sample data, organize the results and compute the value of the test statistics. 6- Make the statistical decision and state the managerial conclusion If the test statistics falls into non-rejection region, DO NOT REJECT Ho If the test statistics falls into rejection region, REJECT Ho The managerial conclusion is written in the context of the real world problem.
REJECT H0 ACCEPT H0 H0 IS TRUE H0 IS FALSE If the null hypothesis is true and accepted or false and rejected the decision is in either case CORRECT. If the null hypothesis is true and rejected or false and accepted the decision is in either case in ERROR.
Example : Fast-Food Restaurant You are manager of a fast-food restaurant. You want to determine whether the waiting time to place an order has changed in the past month from its previous population mean value of 4.5 minutes. A-) State the null Hypothesis and Alternative Hypothesis From past experience, you can assume that the population is normally distributed with the standard deviation of 1.2 minutes. You select a sample of 25 orders during one-hour period. The sample mean is 5.1 minutes. B- Determine whether there is evidence at the 0.05 level of significance that the population mean waiting time to place an order has changed in the past month from its previous population mean value of 4.5 minutes. C- Find and use p-Value approach to test the Hypothesis.
Exercise - 1 One Tailed Test TEST at the 5% level whether the single sample value of 172 comes from from a normal population with mean µ= 150 and variance σ2=100.
Exercise –McDonald One Tailed Test In one past study, McDonald’s had a mean service time of 174.22 seconds. Suppose that this company began a quality improvement effort to reduce the service time and selected a sample of 25 stores. The sample mean has been calculated as 162.96 seconds and sample standard deviation is 20.2 seconds. You wish to determine whether the new drive-through process has a mean that is less than 174.22 seconds.
Exercise –Internet Access Z-test for Proportion Of 2000 adults, 1540 said that they wanted Internet Access so, they could check personal e-mail while on vacation. A survey conducted in the previous year indicated that 75% of adults wanted Internet Access. Is there evidence that the percentage of adults who wanted Internet Access has changed from the previous year
Exercise –Fast Food One Tailed Test for Proportion A fast food chain has developed a new process to ensure that orders at the drive-through are filled correctly. The business problem is defined as determining whether the new process can increase the percentage of orders processed correctly. The previous process filled orders correctly 85% of the time. Data are collected from a sample of 100 orders using the new process. The results indicate that 94 orders were filled correctly. At the 0.01 level of significance, can you conclude that the new process has increased the proportion of orders filled correctly?
Exercise - 2 One Tailed Test TEST at the 1% level whether the single sample value 54 has been drawn from a normal population with mean 65 and variance 30 or whether the mean is less than 65.
Exercise – 3 The manager of the women`s dress department of a department store wants to know whether the true average number of women`s dresses sold per day is 24. If in a random sample of 36 days the average number of dresses sold is 23 with a standard deviation of 7 dresses, Is there, at the 0.05 level of significance, sufficient evidence to reject the null hypothesis that µ=24?