Matplotlib-Python-Plotting-Library
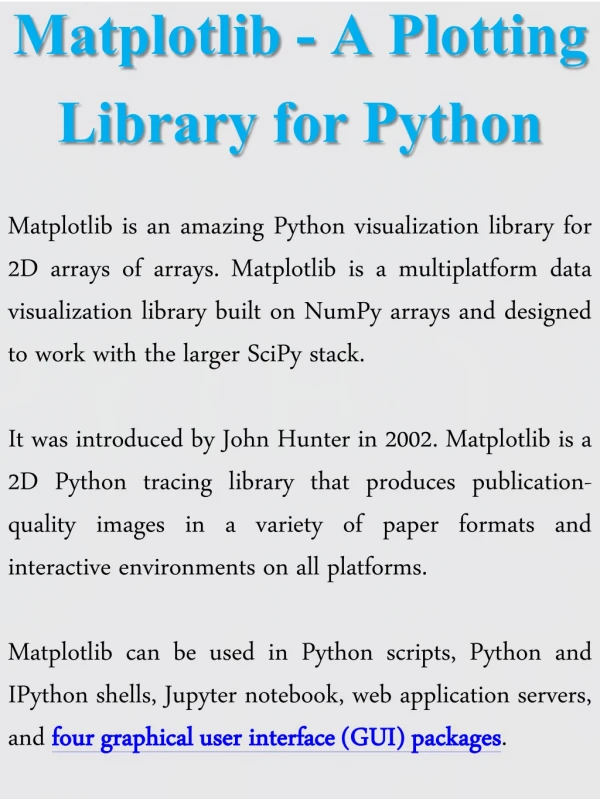
Matplotlib is a powerful and widely-used plotting library in Python that enables users to create static, interactive, and animated visualizations. Designed to work seamlessly with NumPy and Pandas, it provides a MATLAB-like interface through its pyplot module, making it easy for beginners and professionals alike to generate a wide range of chartsu2014from simple line graphs and bar charts to complex 3D plots. Ideal for data analysis, scientific computing, and machine learning projects, Matplotlib offers fine-grained control over every element of a figure, including axes, labels, colors, and more.


Matplotlib-Python-Plotting-Library
E N D
Presentation Transcript
Matplotlib: Python Plotting Library A comprehensive library for creating static, animated, and interactive visualizations in Python.
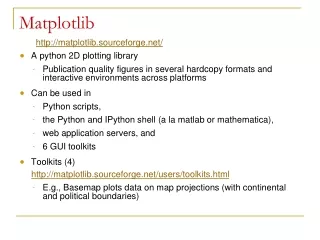
What is Matplotlib? Cross-Platform Numerical Data Data visualization library for Python, compatible with various operating systems. Works closely with NumPy for efficient handling of numerical data arrays. Open-Source Diverse Charts A powerful, free alternative to commercial plotting software like MATLAB. Enables a wide range of plot types including histograms, scatter, bar, line, and pie charts.
Installing and Importing Matplotlib Installation Importing Pyplot pip install matplotlib import matplotlib.pyplot as plt Easy installation using Python's package installer, pip. The standard convention for importing the pyplot submodule. Pyplot provides a MATLAB-like interface for creating and managing figures and axes, simplifying plotting tasks.
Core Components Pyplot Figure Axes A collection of functions providing a convenient interface for plotting. The top-level container that holds all plot elements. The actual area where data is plotted, capable of hosting multiple plots within one figure. Matplotlib supports both interactive and static backends, allowing for flexible rendering.
Common Plot Types Line Plots Scatter Plots Bar Charts Visualize trends and changes over continuous data, perfect for time series. Show relationships and distributions between two variables, identifying correlations. Compare categorical data and display quantities for distinct categories. Histograms Pie Charts Display the distribution of a dataset, showing frequency of data points. Represent proportions and percentages of a whole dataset, ideal for composition.
Customization and Styling Matplotlib offers extensive options to tailor your plots visually. • Control colors, line styles, and markers for distinct data representation. • Add titles, axis labels, gridlines, and annotations for clarity. • Apply predefined stylesheets like 'ggplot' or 'seaborn' for consistent themes. • Fine-tune figure size and resolution (DPI) for precise output.
Advanced Features 3D Plotting Animated Plots Explore multi-dimensional data with the mpl_toolkits.mplot3d toolkit. Create dynamic visualizations for data that changes over time. Integration Interactive Plots Seamlessly works with Jupyter notebooks and various GUI toolkits. Enable zoom, pan, and tooltips for deeper data exploration.
Matplotlib vs. Other Libraries Matplotlib Highly customizable, publication-quality figures Steeper learning curve, requires more code for complex plots Seaborn Built on Matplotlib, excels at statistical plots, beautiful defaults Less control over low-level details, best for specific statistical tasks Plotly Interactive web-based plots, dashboard integration Can be slower for very large datasets, requires more external dependencies Matplotlib remains the foundational library for many other visualization tools in Python.
Best Practices and Tips Object-Oriented API Modular Code Use the object-oriented approach for more control and complex visualizations. Break down plotting logic into reusable functions for maintainability. Documentation Leverage the comprehensive official documentation and community examples. Pandas Integration Combine with Pandas DataFrames for quick and efficient data plotting.
Summary Versatile & Powerful: Matplotlib is a foundational Python plotting library. Diverse Output: Supports static, animated, and interactive charts for various needs. Essential Tool: A key resource for data scientists, researchers, and engineers. Continuous Evolution: Ongoing development ensures modern features and broad compatibility.