Python Lab Matplotlib - I
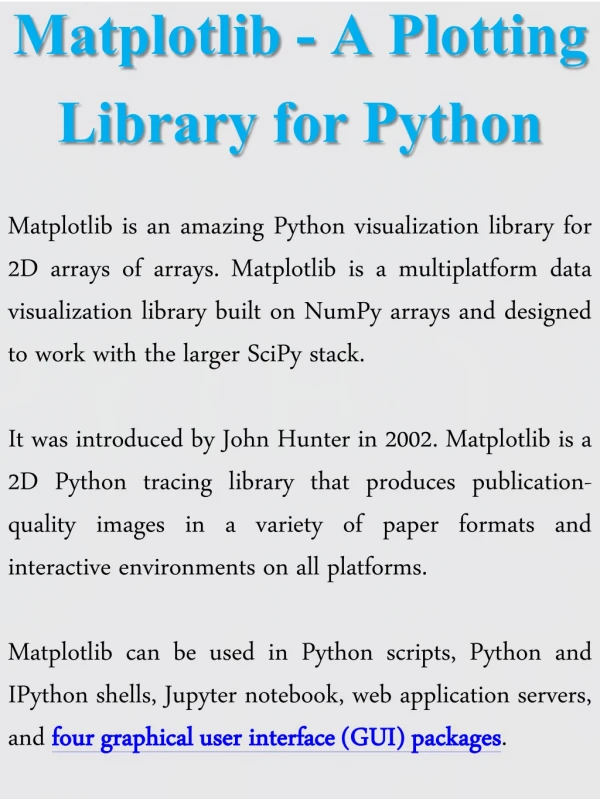
Python Lab Matplotlib - I. Proteomics Informatics, Spring 2014 Week 9 25 th Mar, 2014 Himanshu.Grover@nyumc.org. From last w eek…. Matplotlib. 2D plotting library (some 3D support) Full- featured Great performance even with large amount of data

Python Lab Matplotlib - I
E N D
Presentation Transcript
Python LabMatplotlib - I Proteomics Informatics, Spring 2014 Week 9 25th Mar, 2014 Himanshu.Grover@nyumc.org
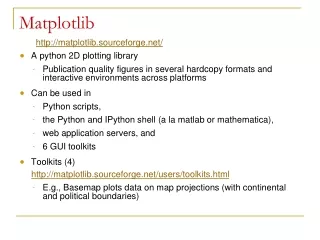
Matplotlib • 2D plotting library (some 3D support) • Full-featured • Great performance even with large amount of data • Very easy to make simple plots, even with default properties • But gives complete and extensive control of every teeny element on your plot • Lots of graphical and text properties • Popular Operational Modes • Interactive work using pylab/pyplot • Using the object-oriented API from a script
Interactive mode: Pyplot • Command-style functions (like R/Matlab) • Each function will make some change to the figure: • Create a figure • Create a plotting area • Throw in some lines and labels • Decorate the plot more with annotations etc. • Hands on…
Next Class • More examples from Pandas and Matplotlib: • Data manipulation • Other types of plots and their properties (scatter, histograms, boxplots etc) • Multiple figures, multiple plots within a figure • Interactive vs. batch plotting; saving figures • Any examples from your research?
References • Matplotlib User Guide and online documentation • Great resource!! • Several examples in gallery, with plot output and working python code. • http://matplotlib.org/contents.html • http://matplotlib.org/index.html