Matplotlib - A Plotting Library for Python
Matplotlib is an amazing Python visualization library for 2D arrays of arrays. Matplotlib is a multiplatform data visualization library built on NumPy arrays and designed to work with the larger SciPy stack.

Matplotlib - A Plotting Library for Python
E N D
Presentation Transcript
Matplotlib - A Plotting Library for Python Matplotlib is an amazing Python visualization library for 2D arrays of arrays. Matplotlib is a multiplatform data visualization library built on NumPy arrays and designed to work with the larger SciPy stack. It was introduced by John Hunter in 2002. Matplotlib is a 2D Python tracing library that produces publication- quality images in a variety of paper formats and interactive environments on all platforms. Matplotlib can be used in Python scripts, Python and IPython shells, Jupyter notebook, web application servers, and four four graphical graphical user user interface interface (GUI) (GUI) packages packages.
One of the main advantages of visualization is that it allows us to visualize huge amounts of data in easily digestible images. Matplotlib consists of several lines such as line, bar, dispersion, histogram, etc. Matplotlib tries to make things easy, easy and difficult. You can generate plots, histograms, power spectra, bar graphs, error diagrams, scatter plots, and so on, with just a few lines of code. For examples, see see the the sample and and the the thumbnail thumbnail gallery gallery. To facilitate tracing, the pyplot module provides a MATLAB interface, especially when combined with IPython. For the experienced user, you have full control of line styles, font properties, axis properties, etc., via an object-oriented interface or via a set of functions well- known to MATLAB users. sample graphics graphics
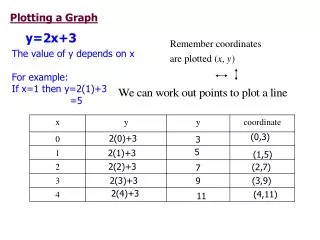
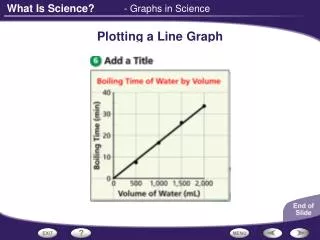
It has a module called pyplot that facilitates tracing by providing functionality to control line styles, font properties, formatting axes, and so on. It is used with NumPy to provide an environment that is an effective alternative to open source code for MatLab. It can also be used with graphical tools such as PyQt and wxPython. Basic Basic parcels parcels in in Matplotlib Matplotlib:: Matplotlib comes with a wide variety of plots. Charts help understand trends, patterns, and correlations. These are usually reasoning tools on quantitative information. Some of the sample parcels are covered here. • Line plot •Bar plot •Histogram •Scatter Plot