Download
1 / 52
520 likes | 1.67k Views
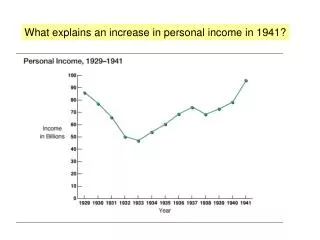
What explains an increase in personal income in 1941?. What were the causes and effects of WWII?. What is this graphic measuring?. What explains the graphic from 1929 to 1933?. What explains the graphic from 1933 to 1937?. Why is the year 2000 included?. ITALY. Soviet Union. Germany.

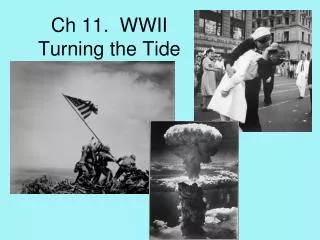
E N D
What is this graphic measuring? What explains the graphic from 1929 to 1933? What explains the graphic from 1933 to 1937? Why is the year 2000 included?
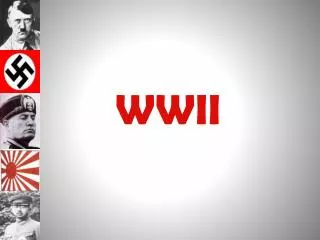
ITALY Soviet Union Germany Spain Japan Benito Mussolini (1922) Joseph Stalin (1924) Adolf Hitler (1933) Francisco Franco (1939) Hideki Tojo (1941) I. WWII Background: 1920s and 1930s -Failure of Treaty of Versailles to make a lasting peace -Worldwide Great Depression -Rise of totalitarian dictators making “promises” to their people -Strong isolationist sentiment around world— no more war -Failure of League of Nations to stop dictators
Czechoslovakia Austria– “Anschluss”
II. WWII: TRIGGER WWII began with Hitler’s invasion of Poland (1939), followed shortly after by the Soviet Union’s invasion of Poland from the east and the Baltic countries – divided Poland. Blitzkrieg (“lightning war”)
Hitler continues reign of terror… During 1st two years of war, U.S. remains officially neutral as Germany overran France and most of Europe. June 23, 1940—Hitler tours Paris
July-October 1940 Battle of Britain- German Luftwaffe (airforce) attack British targets. British people suffer, but RAF pilots fights back and a frustrated Hitler calls off attack. “Never in the field of human conflict was so much owed by so many to so few.” Winston Churchill
In 1941, Hitler turned on his former partner and invaded the Soviet Union.
What is America’s role during the 1st two years of WWII? U.S. is “officially neutral” for first 2 years but….
Lend-Lease Act- U.S. gives Britain war supplies and old naval warships in return for military bases in Bermuda and Caribbean. “lending a garden hose to a next-door neighbor whose house is on fire.” Franklin Roosevelt
Lend-Lease … “the great arsenal of democracy.” FDR
III. WWII: U.S. Entry 1930s Japan sought military and economic domination over Asia-- invaded Manchuria and China
III. WWII: U.S. Entry U.S. refused to recognize Japanese conquests. Imposed an embargo on exports of oil and steel---tensions rise.
III. WWII: U.S. Entry While negotiating with U.S. and without warning, Japan carried out an air attack on the American naval base at Pearl Harbor, Hawaii— Dec. 7, 1941. 1 ½ hours: 180 Japanese warplanes 2,403 Americans dead 1,178 Americans wounded 21 ships - - 8 battleships 300 aircraft
III. WWII: U.S. Entry Japan destroyed much of the American Pacific fleet and killed several thousand Americans. Congress declares war on Japan. “…a date that will live in infamy.” FDR
U.S.S. Arizona Memorial- In memory of nearly 1,000 servicemen trapped inside on Dec. 7, 1941. Dorie Miller- USS West Virginia Navy Cross for bravery
WWII: PRACTICE QUIZ • What were 2 background causes of WWII? • What did Adolf Hitler promise the German people in the 1930s? • What event “triggered” the beginning of WWII in Europe? • What year did WWII begin in Europe? • What was the Battle of Britain? • What country did Hitler invade in 1941, breaking his short-term • pact with this country? • 7. What was the U.S. role during the first two years of WWII? • 8. “lending a garden hose to a neighbor whose house is on fire” • is FDR’s words referring to what U.S. policy? Define. • What does Japan do in the 1930s and how • does the U.S. react? • What event brought the U.S. into WWII? • What is the date that FDR said “would live in infamy?”
IV. WWII: U.S. Homefront Anti-Japanese prejudice on West Coast False belief that Japanese Americans were aiding the enemy
110,000 Japanese Americans were relocated to internment camps
Korematsu v. U.S. (1944)- Supreme Court upheld decision, “military necessity.”
Public apology was eventually issued by the U.S. gov’t. Financial payment of $20,000 promised to each Japanese-American survivor. “We can never fully right the wrongs of the past. But we can take a clear stand for justice and recognize that serious injustices were done to Japanese Americans during WWII.” George Bush (1990)
Economic Resources: • U.S. gov’t and industry • forged close relationship
Economic Resources: • U.S. gov’t and industry • forged close relationship • Rationing was used to • maintain supply of • essential products What does this poster encourage you to save?
Economic Resources: • U.S. gov’t and industry • forged close relationship • Rationing was used to • maintain supply of • essential products • War Bonds and income tax • to finance war What symbols encourage Americans to buy War Bonds?
Economic Resources: • U.S. gov’t and industry • forged close relationship • Rationing was used to • maintain supply of • essential products • War Bonds and income tax • to finance war • Business retooled from • peace time to wartime • (cars to tanks) What factory method does is this image demonstrate?
Human Resources: • 6 million women replaced • men in factories • (Rosie the Riveter)
Human Resources: • 6 million women replaced • men in factories • (Rosie the Riveter) • 2 million minority workers • move to cities for jobs
Human Resources: • 6 million women replaced • men in factories • (Rosie the Riveter) • 2 million minority workers • move to cities for jobs • Women and minorities • fight to end • discriminatory practices
Human Resources: • 6 million women replaced • men in factories • (Rosie the Riveter) • 2 million minority workers • move to cities for jobs • Women and minorities • fight to end • discriminatory practices • Citizens volunteer support What is this boy doing to support the war effort?
Military Resources: • Draft / selective service • to gain personnel (10 million)
Military Resources: • Draft / selective service • to gain personnel (10 million) • Censorship in reporting war
Military Resources: • Draft / selective service • to gain personnel (10 million) • Censorship in reporting war • Public morale and • ad campaigns kept • America focused on war
Military Resources: • Draft / selective service • to gain personnel (10 million) • Censorship in reporting war • Public morale and • ad campaigns kept • America focused on war • Movies, plays, shows, • boosted morale and • patriotic support for war • and portrayed enemy in • stereotypical ways
Daffy Duck: The Commando In what way does the cartoon depict the Nazis?