Download
1 / 1
10 likes | 346 Views
Flow Data. Flow Data. Flow Data. Flow Data. Flow Data. Line Generation. Visualization. Motion Capture. Geometric Model. Flow Simulation. Datalines API. Lines Dataset. Volume Mesh. Mocap Data. R. Weinstein, E. Hueso, I. Pivkin, S. Swartz, D. H. Laidlaw, G. Karniadakis, K. Breuer

E N D
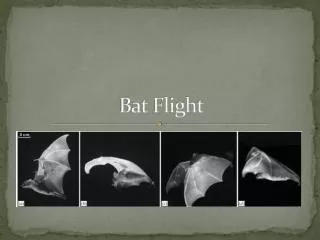
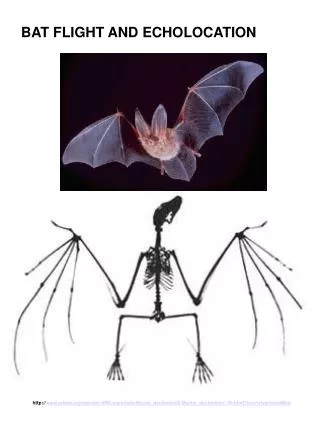
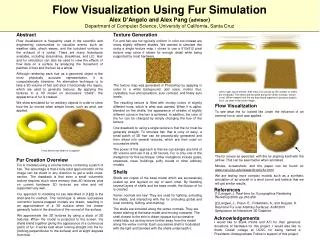
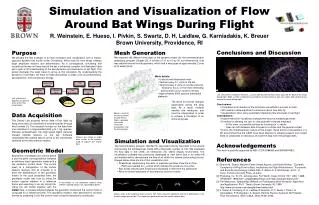
Flow Data Flow Data Flow Data Flow Data Flow Data Line Generation Visualization Motion Capture Geometric Model Flow Simulation Datalines API Lines Dataset Volume Mesh Mocap Data R. Weinstein, E. Hueso, I. Pivkin, S. Swartz, D. H. Laidlaw, G. Karniadakis, K. Breuer Brown University, Providence, RI Simulation and Visualization of Flow Around Bat Wings During Flight Conclusions and Discussion Mesh Generation We imported 160 different time steps of the dynamic model into the commercial grid-generating program Gridgen [3]. A volume of 10 by 10 by 20 non-dimensional units was defined around the bat geometry, which had a wing span of approximately 2 units at its widest point. Purpose We present the first example of air flow simulation and visualization over a motion-captured dynamic bat model (order Chiroptera). When bats fly, their wings undergo large amplitude motions and deformations. As a consequence, simulating and visualizing the way air flows around the bat is extremely complex, and biologists have yet to gain a full understanding of the aerodynamics and mechanics of bat flight. This poster illustrates the steps taken to arrive at this simulation. By understanding the dynamics of bat flight, we hope to make discoveries in areas such as biomechanics, aerodynamics, and evolutionary biology. • Mesh details: • Unstructured tetrahedral mesh • Vertices every 0.1 units on the bat • Vertices every 2 units on volume surfaces • - Allows for focus on the more interesting events which occur closer to the bat. • Approximately 6000 spectral tetrahedral elements Left, streamlines seeded at minimum 2 values demonstrate vortices which occur off the back of the wings during flight. Right, another method of visualizing the air flow known as eels also shows high vorticity areas around the wings during flight. Left, a flow chart diagrams the path to arrive at the final visualization. The mesh for the bat changes significantly during the wing beat. As a result, multiple meshes are necessary and must be interpolated in order to achieve a simulation of an entire wing beat. • Conclusions: • Completed a full iteration of the simulation-visualization process for bats • Still unable to draw significant conclusions about how bats fly • Visualizations show many potentially interesting flow structures in bat flight • Contributions: • A good method of visualizing unsteady flow around unsteady geometry • A method of allowing the user to view data with a biased emphasis • - In this case, on possible vortices by focusing on 2 values • - User can shift between data focused on vortices and the general context • Due to the interdisciplinary nature of this project, these forms of visualization in a 3D environment like the CAVE have been effective in allowing experts from varied fields to collaborate in new ways and see the data from new perspectives. Data Acquisition Above, a mesh of the entire volume around the bat. Right, a detailed view of the increased triangulation near the bat geometry. The Swartz Lab acquired motion data of bat flight by flying more than 20 individuals of several species through wind tunnels [1]. This research focuses on the data from one individual of a large-bodied (600 g to 1 kg) species, Pteropus poliocephalus. Two high-speed digital cameras tracked infrared markers on the bat. Software interpolated the camera data to arrive at 3D coordinates centered at the bat’s sternum marker. Markers are visible as bright white circles to the cameras used to capture the motion data. • Simulation and Visualization • The fluid-simulation program, NekTar [3], calculated velocity field data in the volume surrounding the animated bat model with a Reynolds number of 100. We visualized the flow data in the CAVE, an immersive, 3D, stereo display environment. The visualization software was previously developed to view blood flow in an artery [4] and worked well to demonstrate the flow of air within the volume surrounding the bat. Images below show photos of this visualization tool. • Streamlines representing the paths of massless particles show the air flow • - Paths are seeded at 2 values which indicate the presence of a vortex • Eels tracks velocity both forward and backward in time from the seed point • Allow for biased emphasis on key features such as vortices Acknowledgements This work is partially supported by NSF (CCR-0086065 and IBN-9874563). Geometric Model Barycentric coordinates are used to define a point-to-point correspondence between an arbitrary mesh geometric model and a low resolution control mesh. The control mesh is a triangulation of the motion capture markers and its purpose is to drive the deformations of the geometric model. In the case presented here, the geometric model was built by fitting the motion capture markers in a reference frame and exporting to an obj format file. Using the obj model together with the motion References [1] Sharon M. Swartz, Maryem-Fama Ismael Aguirre, and Kristin Bishop. ``Dynamic Complexity of Wing Form in Bats: Implications for Flight Performance.'' Functional and Evolutionary Ecology of Bats. Eds. Z. Akbar, G. F. McCracken, and T. H. Kunz. Oxford University Press, at press. [2] Pointwise, Inc. 213 S. Jennings Ave. Fort Worth, Texas 76104-1107, USA. 1-888-GRDIGEN. 1996-2001. gridgen@pointwise.com http://www.pointwise.com/ [3] Tim Warburton. Spectral/hp Methods on Polymorphic Multi-Domains: Algorithms and Applications. Ph.D. Thesis, Brown University, RI, 1999. http://www.cfm.brown.edu/people/tcew/nektar.html [4] J. Sobel, A. Forsberg, D. H. Laidlaw, R Zeleznik, D. F. Keefe, I. Pivkin, G. Karniadakis, P. Richardson, S. Swartz. Particle Flurries: Synoptic 3D Pulsatile Flow Visualization. IEEE CG&A, 24(2):76-85, 2004. A tessellation of the geometric model’s wing. Different colored regions are separated by bones. motion data, a correspondence between the geometric model and the control mesh is computed for a reference frame. The geometric model is then deformed for all other frames by projecting it onto the control mesh using the barycentric coordinates. Above, shots of the wing beat taken at every 12th frame show the significant amount of deformation in the model’s wings during flight. This model was generated from the motion capture data.