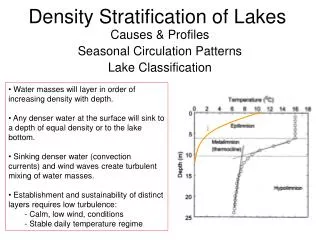
Physical / Chemical Drivers of the Ocean in a High CO 2 World
Physical / Chemical Drivers of the Ocean in a High CO 2 World. Laurent Bopp IPSL / L SCE, Gif s/ Yvette , France. Introduction. Food Web / Fisheries. Climate. Atmospheric Components : CO 2 , DMS , CH4, N2O,…. Atmosphere. Biosphere Soils. Ocean. Circulation, Temperature,

Physical / Chemical Drivers of the Ocean in a High CO 2 World
E N D
Presentation Transcript
Physical / Chemical Drivers of the Ocean in a High CO2 World Laurent Bopp IPSL / LSCE, Gif s/ Yvette, France
Introduction Food Web / Fisheries Climate Atmospheric Components : CO2, DMS, CH4, N2O,… Atmosphere Biosphere Soils Ocean Circulation, Temperature, Light, Dust, … Marine Biogeochemistry Sediment
Which aspects are relevant to marine biogeochemistry ? 6 Introduction 4 Temperature Change (°C) 2 Coupled Model’s response to increased Atmospheric pCO2 0 9 (IS92a, IPCC 2001) 6 3 Precipitation Change (%) 0 5 Max. Atlantic Over. (%) -5 -15 1850 1900 1950 2000 2050 2100
Marine Biogeochemistry Carbon Cycle O2 Cycle Nutrients Cycle Marine Productivity Ecosystem Structure Introduction Drivers of Marine Biogeochemistry Atmospheric pCO2 Temperature Circulation (Advection & Mixing) Light Supply Dust Deposition Rivers Input …
Tools : Ocean-Atmosphere General Circulation Models IPSL Coupled Model
Tools : Biogeochemical Models for the Global Ocean Geochemical Models …… to ….. Simple Ecosystem Models PO43- Diatoms NH4+ Si PO43- Phyto PO43- Nano-phyto NO3- Iron MicroZoo Dissolved Zoo D.O.M Meso Zoo P.O.M Particles Particles Small Ones Big Ones Euphotic Layer (100-150m)
Outline 1. Increased Atmospheric pCO2 Atmospheric pCO2 Temperature Circulation (Advection & Mixing) Light Supply Dust Deposition Rivers Input … Carbon Cycle O2 Cycle Nutrients Cycle Marine Productivity Ecosystem Structure
Outline 1. Increased Atmospheric pCO2 2. Oceanic Circulation (Advection / Mixing) Atmospheric pCO2 Temperature Circulation (Advection & Mixing) Light Supply Dust Deposition Rivers Input … Carbon Cycle O2 Cycle Nutrients Cycle Marine Productivity Ecosystem Structure
Outline 1. Increased Atmospheric pCO2 2. Oceanic Circulation (Advection / Mixing) 3. Atmospheric Dust Deposition Atmospheric pCO2 Temperature Circulation (Advection & Mixing) Light Supply Dust Deposition Rivers Input … Carbon Cycle O2 Cycle Nutrients Cycle Marine Productivity Ecosystem Structure
Increase in DIC leads to an acidification of Ocean waters Changes in Surface pH All OCMIP2 Models +0.5 40°N +0.3 0° -0.3 40°S -0.5 -0.4 -0.2 0 IS92a, IPSL model, 2099-PreIndus (See Poster by J. Orr) Changes in pH : Acidification
Impact of Acidification on Marine CaCO3 Production (C. Heinze, HAMOCC4) Changes in CaCO3 Production (%), 2200 - PreIndustrial Changes in pH & Marine Production / Ecosystem Many studies have revealed/estimated the impact on marine ecosystems
Shoaling of Max. Mixed Layer Depth… Consistent in 6 OAGCMs (m) Shoaling 80°N +1000 IPSL NCAR Princeton MPIM Hadley CSIRO +100 40°N +10 0° 0 -10 40°S -100 80°S -1000 (m) IPSL-CM2, MML, 2075-Present Sarmiento et al. in press Changes in Ocean Physics : Stratification
Changes in Ocean Physics : Stratification Sarmiento et al. in press Mechanisms of Changes D SST D SSS D Mixed Layer 80°N 80°N +1000 +100 40°N 40°N +10 0° 0° 0 -10 40°S 40°S -100 80°S 80°S (°C) (psu) (m) Changes in Winds : increase in Southern Ocean but …
Changes in Ocean Physics : Stratification Implications for the Carbon Cycle Implications for the Oxygen Cycle Implications for Marine Productivity & Ecosystem
Changes in Ocean Physics & Carbon Cycle IPCC, 2001 Climate Change Impact Climate Change reduces ocean CO2 sink (from –6% to –25% in 2050)
Re-Organisation of the Natural C Cycle Thermal Circulation -52 -117 +111 Sarmiento 96 -48 -41 +33 Matear 99 -68 -15 +33 Joos 99 (in GtC/yr, 1850-2100) Changes in Ocean Physics & Carbon Cycle Mechanisms
Changes in Ocean Physics & Carbon Cycle Climatic Effect on CO2 sink at 4xCO2 (HAMOCC3-OPA-LMD) gC m-2yr-1 Decrease sink Increase sink Main Effect : Stratification prevents anthropogenic CO2 penetration
Models suggest an amplification of this decrease in the coming decades (Bopp et al. 2002, Plattner et al. 2002, Matear et al. 2000,…) Zonal Mean, Global Ocean, Changes in O2, 2100 - Present Depth The main driver is stratification (reduced ventilation & mixing) Changes in Ocean Physics & Oxygen Cycle Recent data have shown O2 decreases in most regions of the ocean in the past 40 years (Emerson et al. 2001, Ono et al. 2001, Wanatabe et al. 2001, Matear et al. 2000, …)
Changes in Ocean Physics & Oxygen Cycle Focus on the Equatorial Pacific Dissolved O2 at 100 m (mmol/l) Anoxic / Suboxic Zone increases by 30 % in 2100
Changes in Ocean Physics & Oxygen Cycle Mechanisms of Changes (3°S, Equatorial Pacific) 0 m SEC Temperature & Currents 300 m 0 m Changes in T & U (2090-1990) 300 m South Equatorial Current : shallower and weaker No more warm & oxygenated water to the sub-surface
Different approaches may be used… Empirical Models based on Observational constraints (see Poster by P. Schultz) Mechanistic Models of Marine Biology Changes in Ocean Physics & Marine Productivity
Zonal Mean (2100-1990) -30 % +30 % • Similar response with different bio & dynamical models Changes in Ocean Physics & Marine Productivity 30 gC m-2 an -1 Simulation NPZD-IPSL, 2100-1990 - 30 gC m-2 an -1 • Decreases globally (-5/10%) BUT increases at high latitudes (+20/30%)
Growing Season lenghtens > +10 days Opposition high/low latitudes Changes in Ocean Physics & Marine Productivity (NPZD-IPSL) Ocean Stratification increases Surface nutrient -5 to –10 % Oligotrophic Gyres Area increases 1xCO2 2xCO2-1xCO2
Changes in Ocean Physics & Marine Productivity Less Nutrient … But Longer Growing Season IPSL NCAR Princeton MPIM Hadley CSIRO 80°N 80°N 40°N 40°N 0° 0° 40°S 40°S 80°S 80°S (m) (days) Sarmiento et al. in press
Increase in N2 fixation with Global Warming Boyd and Doney (2002) +1 +0.2 Decrease in diatoms relative abundance +0.02 -0.02 -0.2 Bopp (2001) -1 Changes in Ocean Physics & Marine Ecosystem
Recent papers suggest a high sensitivity of atmospheric dust loading to climate change Mahowald and Luo (2003) : dust loading changes -20 / -60 % Tegen et al. (2004) : dust loading changes +10 / -25 % Mechanisms of changes Sources of Dust Land Use CO2 Fertilization Climate Change Transport Changes in Dust Deposition
Sensitivity Exp: Dust deposition x2 or /2 (20 yr) D Chl (mg/m3) +0.5 +0.5 +0.1 +0.1 -0.1 -0.1 -0.5 -0.5 Changes in Dust Deposition & Marine Productivity Dust Deposition ……… and annual-mean Chlorophyll (M. Werner & I. Tegen)(PISCES model, O. Aumont) 5 1 (mg/m3) 0 (see talk by O. Aumont)
But large uncertainties remain… in particular concerning … Ocean Physics (Mixing ? Southern Ocean Circulation ?) Dust Deposition Changes Impact on Ecosystem Structure Many Thanks to … O. Aumont, J. Orr & OCMIP, C. Heinze, J. Sarmiento, I. Tegen, M. Werner, … Conclusions In a high CO2 world, the ocean will be… More acidic More stratified More oligotrophic, but better light conditions Less oxygenated
Climatic effect : - pCO2 : + 70 ppm (20 %) - Temperature : ~15-20 % Observations Coupled simulation Uncoupled simulation 1860 2000 2100 pCO2 (ppm) Oceanic Carbon Cycle : Coupling climate and carbon Climate (OPA-LMD) Emissions pCO2 Carbon models (HAMOCC3,SLAVE)
Geochemical Flux (gC m-2 an-1) of anthropic CO2 at 700 ppm Hadley • Differences : IPSL (OPA-LMD-HAMOCC3) - Terrestrial Biosphere - Oceanic Sink Southern Ocean Ocean Carbon Cycle : Coupling carbon and climate • Comparison to Cox et al. 2000 IPSL : 700 ppm 770 ppm Hadley : 700 ppm 950 ppm Climatic Effect
Mechanisms : Stratification Nutrient Supply Silica and Iron Limitation Diatoms/ NanoPhyto Diatoms Abundance with Global Warming(using the PISCES model) Diatoms replaced by NanoPhyto at mid/high Latitudes +1 +0.2 +0.02 -0.02 -0.2 -1 Changes in Diatoms Abundance (2090-1990)