Download
1 / 34
340 likes | 585 Views
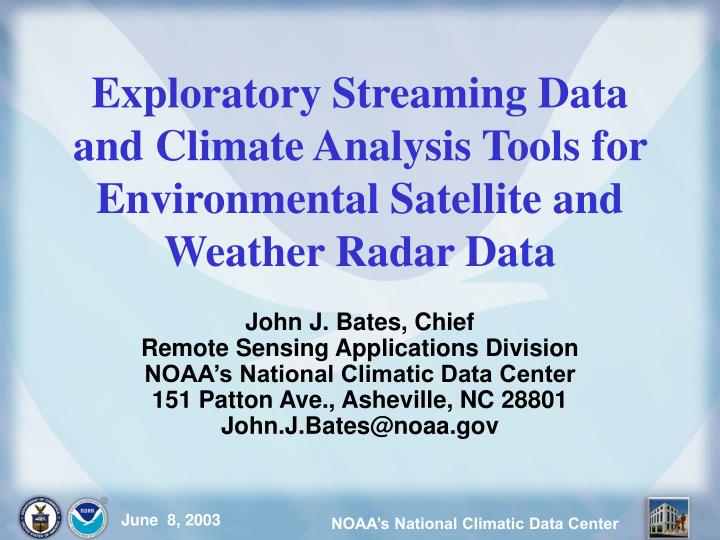
Exploratory Streaming Data and Climate Analysis Tools for Environmental Satellite and Weather Radar Data. John J. Bates, Chief Remote Sensing Applications Division NOAA’s National Climatic Data Center 151 Patton Ave., Asheville, NC 28801 John.J.Bates@noaa.gov. Outline.

E N D
Exploratory Streaming Data and Climate Analysis Tools for Environmental Satellite and Weather Radar Data John J. Bates, ChiefRemote Sensing Applications DivisionNOAA’s National Climatic Data Center151 Patton Ave., Asheville, NC 28801John.J.Bates@noaa.gov
Outline • Introduction – NOAA NESDIS Data Services • Climate observing system performance monitoring • Detection of long-term climate trends using environmental satellite data • Time-space analysis of massive observational data sets • Extreme event detection using weather radar data • Conclusions
NESDIS MISSION:The NOAA NESDIS mission is to provide and ensure timely access to global environmental data from satellites and other sources to promote, protect, and enhance the Nation’s economy, security, environment, and quality of life. To fulfill its responsibilities NESDIS acquires and manages the Nation’s operational environmental satellites, provides data and information services, and conducts related research.
OAR Climate Research Long-Term Climate Modeling Monitoring of Atm Composition Ocean Obs NWS Climate Prediction Regional/Local Forecasting Outreach In Situ Obs Climate Obs & Services Sustained Obs Assessments/ Predictions Trans. to Operations NOAA Climate Observations and Services NESDIS Operational Satellites Climate Data & Inf Mgmt Climate Monitoring
Climate • Climate research and monitoring capabilities should be balanced with the requirements for operational weather observation and forecasting within an overall U.S. strategy for future satellite observing systems1 • 1 NAS/NRC Report on Integration of Research and Operational Satellite Systems for Climate Research (2000)
Geostationary Operational Environmental Satellite (GOES) Polar-Orbiting Operational Environmental Satellite (POES) In Situ Surface and Upper Air Observations NEXRAD Weather Radar National Polar-Orbiting Environmental Satellite System (NPOESS) Environmental Data Management National Climatic Data Center National Oceanographic Data Center National Geophysical Data Center Applications Research and Development NESDIS Programs that Support Monitoring the Earth-Climate System
Managing the Nation’s Operational Environmental Satellite Systems Polar Orbiting Satellites Geostationary Satellites
Geostationary Satellites Warnings to U.S. Public -- Detect, track and characterize Hurricanes Severe or possibly tornadic storms Flash flood producing weather systems Imagery and soundings for weather forecasting Winds for aviation and NWS numerical models Environmental data collection – Platforms including buoys, rain gauges…
GOES Program Overview • GOES satisfies National Weather Service (NWS) requirements for 24 hour observation of weather and Earth’s environment to support storm-scale weather forecasting by forecasters and numerical models • To meet requirements, GOES continuously maintains operational satellites at two locations (75 degrees West and 135 degrees West), with an on-orbit spare ready in case of failure On-Orbit Storage Operational Spacecraft
POES Program • To provide UNINTERRUPTED flow of global environmental information in support of operational requirements for: • Global Soundings • Global Imagery and Derived Products • Global and Regional Surface & Hydrological Obs • Direct Readout, Data Collection, Search and Rescue • Space Environment and Ozone Obs • This requires two satellites on-orbit to allow for continuous coverage during the inherent time it takes to launch and checkout a replacement satellite.
In Situ – Surface and Upper Air • Surface in situ data are ingested from automatic weather reporting stations in remote locations, airports, and weather service field sites • Upper air observations are ingested from weather balloons that are launched twice a day to provide detailed temperature and moisture profiles
NEXRAD Weather Radar Observations • Over 100 NEXRAD weather radars operate continuously to detect both rain and doppler velocity (for tornado vortex signatures • Data was originally recorded on tape at each weather service office • About half the sites are now transmitting data in real-time to the archive via the Abelene and the remaining sites wil by the end of the year
National Polar-Orbiting Operational Environmental Satellite System – Next Generation System Mission Statement To provide a single, national, operational, polar remote-sensing capability to acquire, receive and disseminate global and regional environmental data To achieve National Performance Review (NPR) cost savings through the convergence of DoD and NOAA environmental satellite programs To incorporate, where appropriate, technology transition from NASA’s Earth Science Enterprise (ESE) 0530 1330 0930 A Presidentially Directed, Tri-agency Effort to Leverage and Combine Environmental Satellite Activities
Unique Role of NOAA’s National Data Centers Acquire data from U.S. and foreign sources Preserve the Nation’s environmental data assets Assemble data into easy to use long-term data sets Provide access to environmental data for business, federal and science users Describe the environment
NOAA’s Data System Capability Manages 3 National Data Centers and 7 World Data Centers Archives over 450 terabytes of data and responds to over 4,000,000 requests per year from over 70 countries Maintains some 1300 data bases containing over 2400 environmental variables Maintains over 535,000 tapes 375, 000,000 film records 140,000,000 paper records NGDC Boulder, CO NODC Silver Spring, MD NCDC Asheville, NC
More Data to Manage Volume growth of new data is outstripping the ability to ingest and process the data sets • NOAA’s cumulative digital archive grew 130 terabytes from 1978-1990 • Grew another 130 terabytes from 1990-1995 • Grew another 130 terabytes in 1996 alone • Currently approximately 800 terabytes By 2004, NOAA will ingest and process more new data in one year than was contained in the total digital archive in 1998.
Application of consistent cloud detection, navigation, error check, retrieval algorithm • Data are checked swath by swath • Data are composited on global grids and also checked • Orbit statistics are saved as metadata for further analysis
Monitoring histogram distribution of mean, 10th and 90th percentile radiances over water • Monitoring the quantiles of the frequency distribution is helpful in determining the calibration stability of instruments • We need ultrafast software to perform these calculations on the massive data rates expected in the future • We could also use ultrafast code for computing clustering or classification information
POES Data Characterization and Bias Monitoring • Limb correction and cloud detection schemes must be assessed and applied • Numerous statistical tools are then applied to assess characteristics of the data • Forward and inverse radiative transfer methods must be applied • Multiple different techniques for intersatellite bias adjustment should be tried
Detection of long-term climate trends using environmental satellite data • Creation of seamless time series – nominal, normalized, and absolute calibration • Application of consistent cloud detection, navigation, error check, retrieval algorithm • Exploratory data analysis techniques • Hypothesis formulation and testing • Ancillary data analysis to confirm hypothesis and long-term trend analysis
Creation of seamless time series • Similar instruments on different satellites give systematic biases • Individual satellites drift later in local time • Individual channels sometimes change over time • Lifetime of satellites varies greatly
Exploratory data analysis techniques –Area average time series/indices, empirical orthogonal function analysis
Hypothesis formulation and testing • Extremes in upper level water vapor occur most frequently in Northern winter and spring • Extremes also occur synchronous with extremes in El Niño events • For La Niña cold events (top), strong westerlies lead to strong eddy activity and high water vapor amounts • For El Niño warm events (bottom), deep convection along the equator leads to no eddies
Ancillary data analysis to confirm hypothesis and long-term trend analysis • Upper tropospheric humidity climatology shows distribution of tropical monsoon-desert system • 20-year trend shows increasing UTH along equator and east Asia, decreasing UTH in subtropics • Confidence levels show only largest trends are significant – confidence intervals are computed using linear scatter, lag-1 autocorrelation, and length of record vs. trend
Time-space analysis of massive observational data sets – radar reflectivity and rainfall • Atmospheric wave motions and phenomena propagate east and west with characteristic speeds • Identification of these phenomena is critical to understanding and forecasting • High spatial and temporal coverage is required to fully sample these phenomena • Several examples are used to illustrate diagnosis and application of this technique
Time-space to wavenumber-frequency analysis • Analyze twice daily satellite radiance data for the global tropics • Apply FFT in both the time and space dimensions • Subtract background red noise spectrum as a function of wavenumber and frequency • Contour resulting spectrum energy • Relate distinctive maximum to idealized equations of motion atmospheric wave solutions
Applying time-space analysis to weather-climate interactions • Outgoing longwave radiation (OLR) anomalies are used to track the propagation of large tropical cloud clusters • Madden-Julian oscillations (MJOs) have been related to changes in North American winter flow pattern regimes and El Niño onset • MJOs and easterly Kelvin waves have also been related to regimes that favor or suppress monsoons and hurricanes
Extreme event detection using remotely sensed data – radar tornado vortex
Evaluating tornado vortex signature classifiers • Bayesian classifier is optimal with respect to minimizing the classification error probability • Multiple Prototype Minimum Distance Classifier (Mpmd) learns a set of one or more prototypes for each class that are meant to represent the patterns in that class. It classifies patterns by finding the prototype with the minimum distance to the pattern • Self Partitioning Neural Network (SPNN) is a special kind of back-propagation network. It is designed to work with two class (Usually a target class and a non-target class) problems
Real-time data streaming of weather radar data • When no precipitation is present, weather radar are kept on ‘clear sky’ mode • Clear sky mode can reveal a number of other atmospheric backscatter phenomena – bugs, smoke, thermal boundaries • Debris from the Columbia disaster were picked up on several radars • Data from the NCDC archive were available immediately for the accident investigation
Conclusions • Data streams from environmental satellites and weather radar are projected to increase geometrically over the next 10-15 years • Statistical tools to analyze these data range from simple to complex, but simple tools remain most useful because the phenomena we are trying to analyze are highly complex • The outlook for hardware to process and store massive amounts of data is good • Additional investment in people is required to ensure future generations have the technical skills required to fully exploit the massive data sets available • We need to collaborate with other researchers in the development and application of tools to mine streaming data