Download
1 / 3
50 likes | 131 Views
Satellite Climate Data Records - Development and Analysis. Purpose

E N D
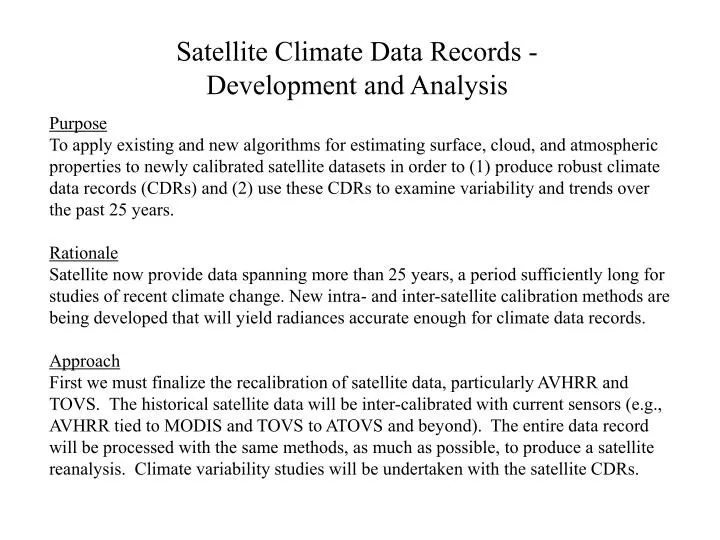
Satellite Climate Data Records - Development and Analysis Purpose To apply existing and new algorithms for estimating surface, cloud, and atmospheric properties to newly calibrated satellite datasets in order to (1) produce robust climate data records (CDRs) and (2) use these CDRs to examine variability and trends over the past 25 years. Rationale Satellite now provide data spanning more than 25 years, a period sufficiently long for studies of recent climate change. New intra- and inter-satellite calibration methods are being developed that will yield radiances accurate enough for climate data records. Approach First we must finalize the recalibration of satellite data, particularly AVHRR and TOVS. The historical satellite data will be inter-calibrated with current sensors (e.g., AVHRR tied to MODIS and TOVS to ATOVS and beyond). The entire data record will be processed with the same methods, as much as possible, to produce a satellite reanalysis. Climate variability studies will be undertaken with the satellite CDRs.
Examples of Recent Arctic Climate Trends from AVHRR Cloud top temperature trend in Spring, 1982 - 1999. Contours indicate confidence levels, color represents the trend. Areas with decreasing trends are marked with dashes. Correlation between the AO index and surface temperature anomalies, 1982 - 1999. Contours in the image stand for the confidence levels.
Example of Trends from TOVS Changes in lower tropospheric winds appear to be linked to changes in sea ice extent. Thermal winds have been calculated for 22 years of TOVS data. Trends in total column u and v wind components for the period 1979-2001 show that the polar vortex has strengthened and shifted toward central Siberia.