Download
1 / 35
350 likes | 465 Views
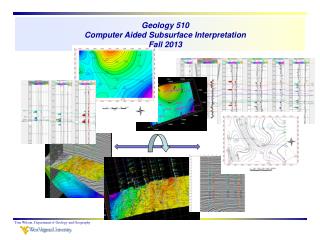
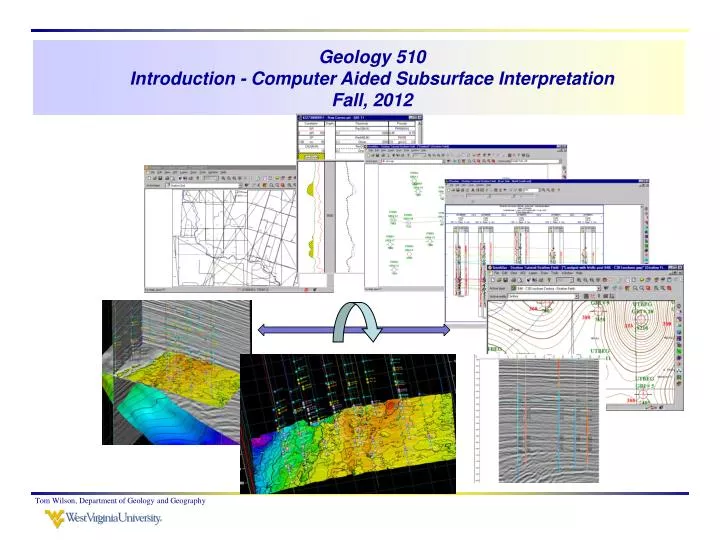
Geology 510 Introduction - Computer Aided Subsurface Interpretation Fall, 2012. Objectives for the day. Contouring basics (some additional review) If time permits - Complete data loading and review of basic Petrel functionality Take some extra time for practice

E N D
Geology 510Introduction - Computer Aided Subsurface InterpretationFall, 2012 Tom Wilson, Department of Geology and Geography
Objectives for the day • Contouring basics (some additional review) • If time permits - • Complete data loading and review of basic Petrel functionality • Take some extra time for practice • Note and additional assignment • For next Wednesday hand in an ~100-200 word description/summary of your ideas concerning the term report you will undertake. Use word - double space. Tom Wilson, Department of Geology and Geography
Contouring discussions – class exercise Tom Wilson, Department of Geology and Geography
Contouring discussions – class exercise Tom Wilson, Department of Geology and Geography
3D Perspective Tearpock & Bischke
Note that positive numbers generally represent increases in elevation above sea level. The T&B convention used here is in error, but you can see what they are trying to convey. Tearpock & Bischke
We’ll adopt T&B’s convention temporarily! Tearpock & Bischke
Need some review? Read T&B Chapter 2 and consider these basic Rules for Contouring Tearpock & Bischke
Guidelines for an Easy to Make and Interpret Map Common reference - Mean Sea Level Constant contour interval Tearpock & Bischke
Guidelines for an Easy to Make and Interpret Map Include scale bar Use of bold contours to highlight regional trends/features Tearpock & Bischke
Scale/Hachured Lines Tearpock & Bischke
Focus initial interpretation in areas of maximum control and then interpolate (with structural style in mind) Tearpock & Bischke
Guidelines for an Easy to Make and Interpret Map We’ll develop a lot of computer contour maps. As you should know by now, contouring algorithms are incapable of following many of the rules we’ve noted and therefore do not accurately represent subsurface structure. Retain a level of skepticism when using computer generated contour maps and always show your basic data Tearpock & Bischke
Is there a good argument for closure here? Would you drill that high? OR – is it a low? Do you believe this? How else might you contour these points? Tearpock & Bischke
Make your closures as big as you can The “biggest” prospect can become the most costly failure. Accurately convey risk associated with an interpretation. As an interpreter you should always have some reason for introducing features not supported by control points. This is usually structural style. Tearpock & Bischke
Uniform slope between points Tearpock & Bischke
Lines Drawn Parallel,Slope Can Vary Uniform and parallel arrangements provide “rules” but your primary guide should be structural style. Tearpock & Bischke
Same Data – Different Maps Managers are likely to consider interpretations (contouring) that is consistent with structural style. Tearpock & Bischke
Uniform Slope Don’t adopt contouring approaches such as uniform slope or parallel spacing just because you happen to like one or the other. The priority is that your contours should be consistent with local structural style Tearpock & Bischke
Interpretative ContouringWe assume “interpretive” - in this instance, implies consistency with local structural style Be careful not to over interpret closures. Make sure you know the sign conventions. Tearpock & Bischke
Same Data – Different Maps Even if consistent with structural style you may still want to be suspicious of the closure A parallel style (closure in an area with no data!) Tearpock & Bischke
Unrealistic Parallel Contour Map When you look at a contour map don’t accept it without questions. Tearpock & Bischke
Unrealistic Parallel Contour MapWhen in doubt – honor the data -8100 -8050 -8150 -8000 -8000 -8150 -8050 -8050 -8100 -8000 -8100 -8000 -8050 Here we try to do a little better job of honoring the data -8100
For the remainder of today • Back to 3D seismic data • Review make/edit surface and basic Petrel functionality • Realize the 3D seismic volume • Crop the volume • Examine Seismic > Settings • Bring up a time slice • Illustrate opacity settings and opacity view • Create an arbitrary line • Spend the remainder of the class in practice, review and catch-up. Tom Wilson, Department of Geology and Geography
organization Tom Wilson, Department of Geology and Geography
To shift that isohocre down to the level of your surfaces, RC > Surface operations Subtract 6420 Tom Wilson, Department of Geology and Geography
Surface operations > arithmatic > subtract Tom Wilson, Department of Geology and Geography
Change background color Tom Wilson, Department of Geology and Geography
Another helpful organizational suggestion: Use multiple viewing windows to retain your work Tom Wilson, Department of Geology and Geography
Continue with materials from Monday Back to seismic ….. Refer to Monday’s slides for details • Realize the volume • Crop the volume • Examine Seismic > Settings • Bring up a time slice • Illustrate opacity settings and view • Create an arbitrary line Tom Wilson, Department of Geology and Geography
Next Time ... Remember there’s no class next Monday, so that exercise will be due Wednesday at the end of class. Between now and next Wednesday, review basic Petrel import, display, make/edit surface, 3D seismic data manipulation and visualization procedures. Next Wednesday hand in an ~100-200 word description/summary of your ideas concerning the term report you will undertake Tom Wilson, Department of Geology and Geography