Download
1 / 40
420 likes | 523 Views
Differential methylation in glucoregulatory genes of offspring born before vs. after maternal gastrointestinal bypass surgery. Authors: Frederic Guenard , Yves Deshales , Katherine Cianflone , John G. Kral , Picard Marceau, and Marie-Claude Vohl PNAS –11440-11444

E N D
Differential methylation in glucoregulatory genes of offspring born before vs. after maternal gastrointestinal bypass surgery Authors: Frederic Guenard, Yves Deshales, Katherine Cianflone, John G. Kral, Picard Marceau, and Marie-Claude Vohl PNAS –11440-11444 Presenters: Lisa J. Martin, PhD and Sarah Ossler, Genetic Counseling Student
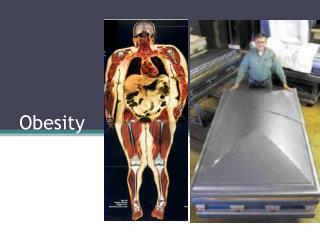
What is Obesity? • An excess accumulation of fat • A disease that affects over one-third of the adult American population. • Each year, causes at least 300,000 excess deaths and healthcare costs of approximately $100 billion in the U.S.
BMI and Categorization of Obesity Body Mass Index (BMI) is a measurement tool used to determine excess body weight • Normal is a BMI less than 25 • Overweight is a BMI of 25 or more • Obesity is a BMI of 30 or more • Morbid obesity is a BMI of 40 or more
Obesity Trends* Among U.S. AdultsBRFSS, 1990, 2000, 2010 2010 2000 1990 2012 No Data <10% 10%–14% 15%–19% 20%–24% 25%–29% ≥30% (*BMI 30, or about 30 lbs. overweight for 5’4” person) Healthy People 2010 Goal – 15% Obesity
Obesity is a Complex Trait Genes Obesity Gene X Gene Gene X Environment Environmental Factors
Early Origins of Obesity • Children of gestational diabetic mothers are more likely to be obese • Children of obese mothers are more likely to be obese • In mice, when mom has diet induced obesity, offspring will develop obesity on chow diet.
Barker Hypothesis • The thrifty phenotype hypothesis • Hypothesized that poor fetal and early post-natal nutrition sets in motion mechanisms of nutritional thrift • Unknown mechanism of action • (Hales CN, Barker DJ, 1992)
Methylation • Can help control gene expression • Unmethylated DNA free to be transcribed • Methylation can silence expression • Most CpG sites across the genome are methylated most of the time • CpG-rich regions (CpG islands) generally unmethylated • Methylation in these areas can silence genes
How Methylation Can Influence Obesity: The Agouti Gene Normal mouse Agouti Mouse
Folate Can Rescue Obesity and Coat Color Phenotype • Folate carries a methyl group • Dietary folate can increase methylation • Dietary folate in agouti mice can rescue the phenotype
Methylation Is a Plausible Mechanism For the Barker Hypothesis • Additional support includes methylation at IGF2 • Associated with newborn anthropometrics (St-Pierre et al. Epigenetics 2012) • Associated with overweight at 1 year of age (Perkins et al. J Peds, 2012) • IGF2 methylation responsive to prenatal diet (Claycombe et al. J Nutr, 2013) • Individuals exposed to famine prenatally demonstrate persistent changes 6 decades later (Heijmans et al. PNAS, 2008)
Natural Experiments To Study Methylation by Prenatal Environment • Supplementation (Agouti mouse) • Famine (IGF2 studies) • Drastic weight loss • Bariatric surgery
Bariatric Surgery • Offers the fastest weight loss • Those obese (BMI ≥ 30) qualify • Know to reduce obesity related co-morbidities
Do the health improvements after bariatric surgery get transmitted to the offspring of bariatric surgery patients?
Purpose of Study This study was designed to analyze the impact of maternal weight loss surgery on methylation levels of genes involved in cardiometabolic pathways in BMS(children born before maternal bariatric surgery) and AMS (children born after maternal bariatric surgery) offspring.
Study Design • Cohort of Offspring Born Before and After Mother’s Bariatric Surgery • Comparisons for • Phenotype (anthropometrics, glucose, lipids, blood pressure) • Methylation profiles • Gene Expression
Study Participants • Subjects • Women from the eastern part of Quebec • Had given birth pre and post biliopancreatic bypass with duodenal switch • Mothers - 20 unrelated individuals, ages 34-51 • Offspring currently aged 2-25 • 25 offspring born pre-surgery, 25 born post surgery • 17 mothers had offspring born both pre and post surgery • 2 mothers had offspring born pre surgery • 1 mother had offspring born post surgery • Mothers and offspring attended the Québec Heart and Lung Institute or a regional hospital for assessment between July and October 2010.
Data Collection • Maternal pre-surgery data obtained from medical records • At the interview, weight and body fat measured by bioelectrical impedance • BMI calculated for mothers • BMI percentile (z-score) calculated for children (CDC growth curves) • Blood samples collected to measure plasma lipid, glucose, and insulin concentrations after overnight fast
Materials and Methods • DNA Methylation Analysis on whole blood • Used Infinum 450k array • Probes across the genome similar to SNP arrays • DNA is • Untreated • Bisulfite treated to turn unmethylated C to T • Measure the treated and untreated signals • β value computed comparing methylated to total signal • β values between 0 and 1 • Validated with mass spec
Methylation: Tissue and Cell types • Epigenotype is tissue and cell specific • Highly variable between different tissue and cell types • DNA derived from blood comes from white blood cells • Neutophils, lymphocytes, monocytes, eosinophils, basophils • Lots of cell types with lots of methylation variation! • Are differences in methylation due to disease or cell type composition? • Age can be a confounder • Methylation is known to change with age
Materials and Methods • Gene Expression Analysis • Total RNA isolated and purified from whole blood • Expression data visualized and analyzed using FlexArray • Gene expression microarray results validated using RT-PCR for top 5 differentially expressed genes
Materials and Methods • Statistical Analysis • Phenotype • Mothers – pre – post surgery – paired t • Offspring • Adjusted for sex and puberty • Method – anova (general linear model) • Methylation • T-tests with FDR correction • Gene Expression • To be considered expressed, a probe had to show detection P value ≤ 0.05 in at least 25% of samples • T-tests, no multiple testing correction • Correlations between phenotype, methylation, and gene expression – Pearson • No description of pathway analysis
Mother’s phenotype improves after surgery 266 lb 165 lb
Results • After correction for effect of sex and puberty • BMS offspring higher weight, height, waist to hip girth (P<0.05) than AMS • AMS offspring showed trend toward lower percentage of body fat (P = 0.07) • AMS offspring had improved fasting insulin (P=0.03), homeostatic model of insulin resistance (HOMA-IR) index (P = 0.03), and lower blood pressure compared with BMS offspring (P < 0.05)
Methylation Differences In AMS/BMS • Offspring Methylation Profiles • detected 485,294 (99.95%) of 485,557 probes on the array • 14,466 probes (corresponding to 5,698 unique genes) exhibited significant differences (FDR) • Differences between BMS and AMS offspring were confirmed using mass spec for CADPS2, LAMC3 and SHANK2
Results • Identification of Altered Functions and Pathways • The ingenuity pathway analysis (IPA) system mapped 5,607 of the 5,698 genes differentially methylated between AMS and BMS offspring • Classified them according to functions and pathways • Calculated P values for function or pathway overrepresentation • Most statistically significant biological functions were related to autoimmune disease, pancreas disorders, DM, and disorders of glucose metabolism
Comparison of Type 1 and 2 Diabetes • Type 1 Diabetes • Auto immune disease • Beta cells attacked by own body • Used to be referred to as “childhood onset” • Type 2 Diabetes • Acquired disease • Beta cells are worn out due to overexpression to control high levels of glucose • Used to be referred to as “adult onset”
Some Correlation of Methylation and Expression Data About 25% of the paired methylation –expression samples showed nominal association
Correlations between Methylation and Expression Data Differ By Methylation State
Correlations Between Gene Methylation, Gene Expression, and Insulin Resistance • Looked at T1DM1 pathway • Out of 121 genes, 48 were differentially methylated • 62 correlations (17 genes) between methylation and expression nominally significant • 12 genes showed correlation between methylation and insulin • 6 genes showed correlation with methylation, expression and insulin • 5 of the 6 had validated gene expression
Discussion • This study found that improving maternal pregravid disease is durably detectable in offspring's phenotype, methylome, and transcriptome • 3% of probes were differentially methylated between AMS and BMS offspring • Glucose metabolism pathways were differentially altered in BMS and AMS offspring • T1DM, T2DM, IGF1
Discussion • Identified differences in gene methylation potentially responsible for greater insulin sensitivity in AMS compared with BMS siblings • Speculated that regulation of immune response genes by differential CpGmethylation in offspring is coherent with the pathogenesis of diabetes
Discussion • Potential mechanisms for the acquisition of increased risks of offspring obesity and T2DM • Epigenetic mechanisms may control the placenta and embryonic epigenetic machinery • Hyperglycemia and oxidative stress may interfere with DNA methylation and affect long-term expression programming • Food intake and energy balance may lead to hypothalamic programming and hormonal changes in the offspring
Limitations • Offspring are both children and adults • Not clear how one can compare BMI z-score (children) to BMI (adults) • Differential methylation analysis • Did not account for relatedness (Some of the subjects in the BMS & AMS were related) • Did not account for age differences in the BMS and AMS – may identify genes associated with differential methylation by age. • Blood sampling to assess methylation • Blood is a sampling of cells – cell composition may influence results • Blood not target tissue for obesity (e.g., fat, muscle, or liver) • Tanner classifications for precise ascertainment of puberty according to sex and age were not available. • Puberty in girls is a period of hyperinsulinemia • Type 1 Diabetes is not related to obesity
Why PNAS? • First paper to look genome wide at methylation changes associated with prenatal exposures • Offers a mechanism for the Barker Hypothesis • With the increasing rates of obesity in young adults, this may help explain the increased rates of obesity in children • These changes may be stable and transmittable to the next generation • Supports health benefits of bariatric surgery prior to conception to change the outcome
References • Duhl DM, Vrieling H, Miller KA, Wolff GL, Barsh GS. Neomorphic agouti mutations in obese yellow mice. Nat Genet. 1994;14:59–65. doi: 10.1038/ng0994-59. • Hales CN, Barker DJ (1992) Type 2 (non-insulin-dependent) diabetes mellitus: the thrifty phenotype hypothesis. Diabetologia 35: 595–601.