Download
1 / 6
300 likes | 655 Views
Multicollinearity. Multicollinearity occurs when explanatory variables are highly correlated, in which case, it is difficult or impossible to measure their individual influence on the response. The fitted regression equation is unstable.

E N D
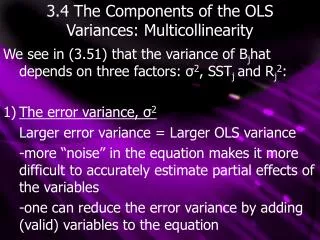
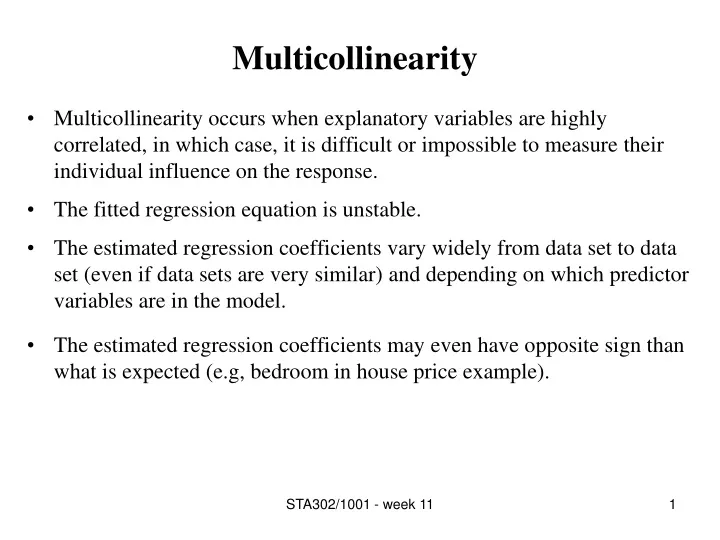
Multicollinearity • Multicollinearity occurs when explanatory variables are highly correlated, in which case, it is difficult or impossible to measure their individual influence on the response. • The fitted regression equation is unstable. • The estimated regression coefficients vary widely from data set to data set (even if data sets are very similar) and depending on which predictor variables are in the model. • The estimated regression coefficients may even have opposite sign than what is expected (e.g, bedroom in house price example). STA302/1001 - week 11
The regression coefficients may not be statistically significant from 0 even when corresponding explanatory variable is known to have a relationship with the response. • When some X’s are perfectly correlated, we can’t estimate βbecause X’X is singular. • Even if X’X is close to singular, its determinant will be close to 0 and the standard errors of estimated coefficients will be large. STA302/1001 - week 11
Quantitative Assessment of Multicollinearity • To asses multicolinearity we calculate the Variance Inflation Factor for each of the predictor variables in the model. • The variance inflation factor for the ith predictor variable is defined as where is the coefficient of multiple determination obtained when the ith predictor variable is regressed against p-1 other predictor variables. • Large value of VIFi is a sign of multicollinearity. STA302/1001 - week 11
Rainfall Example • The data set contains cord yield (bushes per acre) and rainfall (inches) in six US corn-producing states (Iowa, Nebraska, Illinois, Indiana, Missouri and Ohio). • Straight line model is not adequate – up to 12″ rainfall yield increases and then starts to decrease. • A better model for this data is a quadratic model: Yield = β0 + β1∙rain + β2∙rain2 + ε. • This is still a multiple linear regression model since it is linear in the β’s. • However, we can not interpret individual coefficients, since we can’t change one variable while holding the other constant… STA302/1001 - week 11
More on Rainfall Example • Examination of residuals (from quadratic model) versus year showed that perhaps there is a pattern of an increase over time. • Fit a model with year… • To assess whether yield’s relationship with rainfall depends on year we include an interaction term in the model… STA302/1001 - week 11
Interaction • Two predictor variables are said to interact if the effect that one of them has on the response depends on the value of the other. • To include interaction term in a model we simply the have to take the product of the two predictor variables and include the resulting variable in the model and an additional predictor. • Interaction terms should not routinely be added to the model. Why? • We should add interaction terms when the question of interest has to do with interaction or we suspect interaction exists (e.g., from plot of residuals versus interaction term). • If an interaction term for 2 predictor variables is in the model we should also include terms for predictor variables as well even if their coefficients are not statistically significant different from 0. STA302/1001 - week 11