Download

1 / 61
610 likes | 1.09k Views
Graduate School Quantitative Research Methods Gwilym Pryce. Module II Lecture 7: multicollinearity, and Modelling Strategies. Notices:. Assignment: much less guidance than for quants I you will be provided with a data set and be expected to construct a regression model from it.

E N D
Graduate School Quantitative Research Methods Gwilym Pryce Module II Lecture 7: multicollinearity, and Modelling Strategies
Notices: • Assignment: • much less guidance than for quants I • you will be provided with a data set and be expected to construct a regression model from it. • The only guidance will be regarding the format of the report and a statement saying that you need to follow “good modelling practice” • I.e. the strategies to be outlined in this lecture.
Plan • 1.multicollinearity • Definition • Causes • Consequences • Diagnosis • Solutions
2. Modelling Strategies • Nightmare scenario... • General to Specific • start with all variables & all sample • reduce & refine as necessary • Specific to General • start with few variables & specific sample • expand & refine incrementally
1. Multicollinearity • Definition • Causes • Consequences • Diagnosis • Solutions
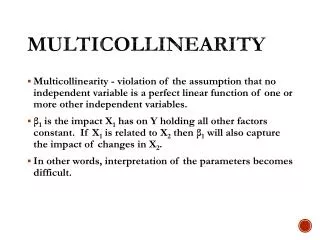
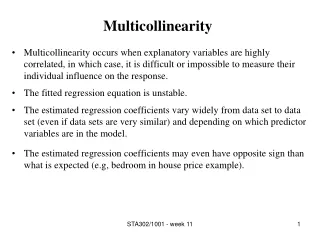
Definition • multicollinearity occurs when the explanatory variables are highly intercorrelated. • This may not necessarily be a problem, but it can prevent precise analysis of the individual effects of each variable • Consider the case of just k = 2 explanatory variables and a constant. For either slope coefficient, the square of the standard error is:
If the two variables are perfectly correlated, r122 = 1 (where r122 is the square of the simple correlation coefficient between x1 and x2), then the variance of the estimated slope coefficient will be infinite:
Perfect multicollinearity usually only occurs because of model misspecification rather than measurement problems • more common case is where the variables are highly but not perfectly correlated
Causes • Causes of Perfect Multicollinearity: • Improper use of dummy variables (e.g. failure to exclude one category) • Including a variable that is computed from other variables in the equation • e.g. family income = husband’s income + wife’s income, and the regression includes all 3 income measures
including the same or almost the same variable twice • e.g height in feet and height in inches; more commonly, two different operationalizations of the an identical concept • e.g. including two different indices of IQ -- the method of measurement is different but the underlying phenomena is fundamentally the same.
The above all imply some sort of error on the researcher’s part. But, it is possible that different causes happen to highly correlated or that measurement methods fail to distinguish the underlying concepts we believe to be causes of y.
Causes of Near multicollinearity • the cause here is measurement problems: • the variables to be measured were not defined in a way that would allow the separation of different effects when the variables come to be analysed • this is why you really need to understand the modelling process before you collect your data
Consequences • Perfect Multicollinearity: • suppose we attempt to estimate the following regression: Consumption = b1 + b2nonlabour income + b3salary + b4total income (Greene p. 267) • it will not be possible to separate out individual effects of the components of income (N + S) and total income (T)
This can be seen if we write the “structural” (I.e. the one we expect in theory) equation as: Chat = b1 + b2N + b3S + b4T and add any nonzero value to these coefficients: Chat = b1 + (b2 +3)N + (b3 +3)S + (b4 +3)T • What we find is that the equation would be true if we added 4 or 4.25 or any value • In other words, this regression specification allows the same value of Chat for many different values of the slope coefficients.
This is called the “identification problem” and most statistical packages will come up with an error message if you try to run a regression suffering from perfect multicollinearity. • Note, though, that this is a poorly specified model and the problems of identification have nothing to do with the quality of the data.
Consequences of Near Multicollinearity: • When the correlation between explanatory variables is high but not perfect, then the difficulty in estimation is not one of identification but of precision. • The higher the correlation between the regressors, the less precise our estimates will be (I.e. the greater the standard errors on the slope parameters):
But even where there is extreme multicollinearity, so long as it is not perfect OLS assumptions will not be violated. • OLS estimates of that particular model are still BLUE (Best Linear Unbiased Estimators) • Alterations to the model, however, may increase efficiency • I.e. reduce the variance of the estimated slopes
When high multicollinearity is present, confidence intervals for coefficients tend to be very wide and t-statistics tend to be very small. • Note, however, that large standard errors can be caused by things other than multicollinearity • e.g. if s2, the standard error of the residuals, is large
When two explanatory variables are highly and positively correlated, their slope coefficient estimators will tend to be highly and negatively correlated. • But a different sample could easily produce the opposite result if there is multicollinearity because coefficient estimates tend to be very unstable from one sample to the next. • Coefficients can have implausible magnitude
Diagnosis • Check for unstable parameter values across subsamples: • Step 1: create an arbitary random variable, Q and order your sample by Q (alternatively you can use the random subsample facility in SPSS) • Step 2: run the same regression on different sub-samples (e.g. first 100 observations vs rest) • Step 3: do F-tests to see if the slopes change
Check for unstable Parameters Across Specification: • try a slightly different specification of a model using the same data. See if seemingly “innocuous” changes (adding a variable, dropping a variable, using a different operationalization of a variable) produce big shifts. • As variables are added, look for changes in the signs of effects (e.g. switches from positive to negative) that seem theoretically questionable.
Check the t ratios: • If none of the t-ratios for the individual coefficients are statistically significant, yet the overall F statistic is, then you may have multicolinearity. • Note, however, the word of caution from Greene:
“It is tempting to conclude that a variable has a low t ratio, or is significant, because of multicollinearity. One might (some authors have) then conclude that if the data were not collinear, the coefficient would be significantly different from zero. • Of course, this is not necessarily true. Sometimes a coefficient turns out to be insignificant because the variable does not have any explanatory power in the model”
Check the Simple Correlation Matrix: • The simple correlation coefficient, r(x,z), has the same sign as the covariance but only varies between -1 and 1 and is unaffected by any scaling of the variables. • This measure is useful if we have only two explanatory variables. • If the number of explanatory variables is greater than 2, the method is useless since near multicolinearity can occur when any one explanatory variable is a near linear combination of any collection of the others.
Thus, it is quite possible for one x to be a linear combination of several x’s, and yet not be highly correlated with any one of them : • the correlation coefficient (which only measures bivariate correlation) to be small, • but for the squared multiple correlation coefficient (I.e. the R2, which measures multivariate correlation) between the explanatory variables to be high. • It is also hard to decide on a cutoff point. The smaller the sample, the lower the cutoff point should probably be.
Check Rk2 • when you have more than one explanatory variable, you should run regressions of each on the others to see if there is multicollinearity • this is probably the best way of investigating multicollinearity since examining coefficients will also help you find the source of the multicollinearity. • If you have lots of regressors, however, this can be a daunting task, so you may want to start by looking at the Tolerance and VIF...
Check the Tolerance and VIF • the general formula (as opposed to the one where you have just 2 regressors) for the variance of the slope coefficient estimate is: • where Rk2 is the squared multiple correlations coefficient between xk and the other explanatory variables • e.g. R2 from the regression: x1 = a1 + a2x2 + a3x3
1 - Rk2 is referred to as the Tolerance of xk. • A tolerance close to 1 means there is little multicollinearity, whereas a value close to 0 suggests that multicollinearity may be a threat. • The reciprocal of the tolerance is known as the Variance Inflation Factor (VIF). • The VIF shows us how much the variance of the coefficient estimate is being inflated by multicollinearity. • A VIF near to one suggests there is no multicolinearity, whereas a VIF near 5 might cause concern.
All the VIF levels in this regression are near to one so there is no real problem. • If VIF where high for a particular regressor, say z, then we might want to run a regression of z on the other explanatory variables to see variables are closely related. • We could then consider whether to omit one or more of the variables • e.g. if on deliberation we decide that they are in fact measuring the same thing
Check the Eigenvalues and Condition Index: • eigenvalues indicate how many distinct dimensions there are among the regressors • when several eigenvalues are close to zero, there may be a high level of multicolinearity. • Condition Indices are the square roots of the ratio of the largest eigenvalue to each successive eigenvalue. • Values above 30 suggest a problem
Two of the eigenvalues are pretty small, but: • the Condition Indices are all below 10 so there is unlikely to be a problem with multicolinearity here.
Problems with the Condition Index Approach: • the condition number can change by a reparametrization of the variables: “it can be made equal to one with suitable transformations of the variables” (Maddala, p. 275) • such transformations can be meaningless • does not tell you whether the multicolinearity is actually causing problems or how to go about resolving the problems if they exist.
Solutions • Solving Perfect Multicolinearity • check whether you have made any obvious errors • e.g. improper use of computed or dummy variables (particularly for perfect multicoly).
Solutions to Near Multicolinearity: • NB: only needs “solving” if it is having an adverse effect on your model • e.g. large SEs, unstable signs on coefficients. • Factor analysis, Principle components or some other means to create a scale from the X’s. • This solution is not recommended in most instances since the meaning of coefficients on your created factors are difficult to interpret:
e.g. 3 problems of Princ. Comp. (Greene p. 273): • “First, the results are quite sensitive to the scale of measurement in the variables. The obvious remedy is to standardize the variables, but, unfortunately, this has substantial effects on the computed results. • Second, the principle components are not chosen on the basis of any relationship of the regressors to y , the variable we are attempting to explain.
Lastly, the calculation makes ambiguous the interpretation of results. The principle components estimator is a mixture of all of the original coefficients. It is unlikely that we shall be able to interpret these combinations in any meaningful way.”
Use joint hypothesis tests: • I.e. as well as doing t-tests for individual coefficients, do an F test for a group of coefficients So, if x1, x2, and x3 are highly correlated, do an F test of the hypothesis that b1 = b2 = b3 = 0. • Omitted Variables Estimation: • I.e. “drop” the offending variable. But, if the variable really belongs in the model, this can lead to specification error, which can have far worse consequences (I.e. bias) than multicollinear model (which is BLUE).
Ridge Regression: • Deliberately adds bias to the estimates to reduce the standard errors • “it is difficult to attach much meaning to hypothesis tests about an estimator that is biased in an unknown direction” (Greene)
2. Modelling Strategies • Whether or not you present the results of the diagnostics to your audience, you MUST construct your model using them otherwise: • how do you know that you have specified it correctly? • How do you know that it can be generalised beyond your little sample!? • E.g. A Salutary Tale… • You construct a model of mortality rate: • mortality rate = b1 + b2 smoking rate + b3 ave age • you did not include in your model a whole range of variables because when you entered them in individually, there were not significant (I.e. t < 2)
however, it turns out that your model suffered from heteroscedasticity and so the t-tests were incorrect: • if used White’s SEs , Unemployment and School Achievement both signif. • You used simple correlation coefficients between variables to identify multicollinearity • => kept Smoking Rate and Age but dropped Unemployment etc • but your method was spurious: actually shoudd drop age and keep Unt and School Achieve
You did not test for parameter stability across subsamples: • Your model was not stable across different parts of the country or over time • in some areas, unemployment was actually the most important driver • estimates based on a subsample of the most recent 4 years showed unemployment to have a much larger coefficient than in your model • your model was actually totally inapplicable to certain areas (Highlands) and subsample Chow tests would have revealed this.
You did not check for non-linearities or interactive effects • turns out that there is a highly significant quadratic relationship with unemployment and a strong interaction with whether or not the area is urban
CONCLUSION: • your model is USELESS!!! • Worse than that, it is misleading and could distort policy outcomes • A few years later, other models are developed (with equal disregard to diagnostics) which produce radically different results, • As a result, policy makers become disollutioned with statistical models and resort to their own “good judgement”! • The world comes to an end an it was all YOUR fault!!!
To avoid this nightmare scenario you need…
… a sound modelling strategy: • General to Specific • start with all variables & all sample • reduce & refine as necessary • Specific to General • start with few variables & specific sample • expand & refine incrementally • One balance, I would recommend the first of these approaches, but both are defensible if used in conjunction with thorough diagnostic testing...
General to Specific model steps: • (i) Theory • (ii) Anticipated Regression Model • (iii) Data Collection • (iv) General Model • (v) Diagnostic Checks and Refinement • (vi) Specific Model • (vii) Revise Theory? • (iix) Present Final Model