Download
1 / 18
250 likes | 795 Views
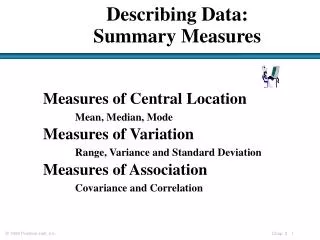
Summary Measures . Summary Measures. Variation. Central Tendency. Quartile. Mean. Mode. Coefficient of Variation. Median. Range. Variance. Midrange. Standard Deviation. Midhinge. Measures of Central Tendency. Central Tendency. Mean. Median. Mode. Midrange. Midhinge.

E N D
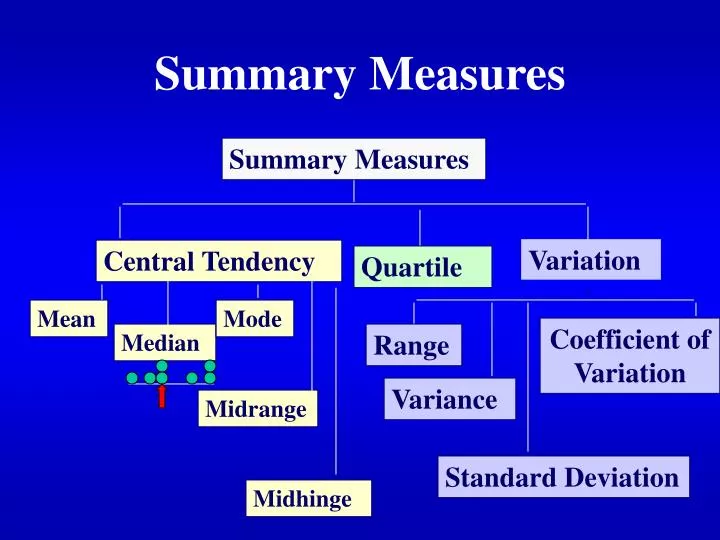
Summary Measures Summary Measures Variation Central Tendency Quartile Mean Mode Coefficient of Variation Median Range Variance Midrange Standard Deviation Midhinge
Measures of Central Tendency Central Tendency Mean Median Mode Midrange Midhinge
The Mean (Arithmetic Average) • It is theArithmetic Averageof data values: • The Most Common Measure of Central Tendency • Affected by Extreme Values(Outliers) Sample Mean 0 1 2 3 4 5 6 7 8 9 10 0 1 2 3 4 5 6 7 8 9 10 12 14 Mean = 5 Mean = 6
The Median • Important Measure of Central Tendency • In an ordered array, the median is the • “middle” number. • If n is odd, the median is the middle number. • If n is even, the median is the average of the 2 • middle numbers. • Not Affected by Extreme Values 0 1 2 3 4 5 6 7 8 9 10 0 1 2 3 4 5 6 7 8 9 10 12 14 Median = 5 Median = 5
The Mode • A Measure of Central Tendency • Value that Occurs Most Often • Not Affected by Extreme Values • There May Not be a Mode • There May be Several Modes • Used for Either Numerical or Categorical Data 0 1 2 3 4 5 6 0 1 2 3 4 5 6 7 8 9 10 11 12 13 14 No Mode Mode = 9
Midrange • A Measure of Central Tendency • Average of Smallest and Largest • Observation: • Affected by Extreme Value Midrange 0 1 2 3 4 5 6 7 8 9 10 0 1 2 3 4 5 6 7 8 9 10 Midrange = 5 Midrange = 5
Quartiles • Not a Measure of Central Tendency • Split Ordered Data into 4 Quarters • Position of i-th Quartile: position of point 25% 25% 25% 25% Q1 Q2 Q3 i(n+1) Q = i 4 Data in Ordered Array: 11 12 13 16 16 17 18 21 22 1•(9 + 1) = Position of Q1 = 2.50 Q1 =12.5 4
Midhinge • A Measure of Central Tendency • The Middle point of 1st and 3rd Quarters • Not Affected by Extreme Values Midhinge = Data in Ordered Array: 11 12 13 16 16 17 18 21 22 Midhinge =
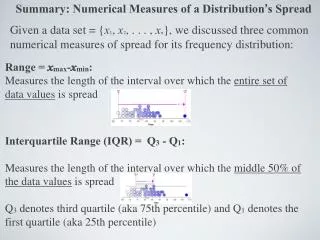
The Range • Measure of Variation • Difference Between Largest & Smallest • Observations: • Range = • Ignores How Data Are Distributed: Range = 12 - 7 = 5 Range = 12 - 7 = 5 7 8 9 10 11 12 7 8 9 10 11 12
Interquartile Range • Measure of Variation • Also Known asMidspread: • Spread in the Middle 50% • Difference Between Third & First • Quartiles:Interquartile Range = • Not Affected by Extreme Values Data in Ordered Array: 11 12 13 16 16 17 17 18 21 = 17.5 - 12.5 = 5
Variance • Important Measure of Variation • Shows Variation About the Mean: • For the Population: • For the Sample: For the Population: use N in the denominator. For the Sample : use n - 1 in the denominator.
Comparing Standard Deviations Data :10 12 14 15 17 18 18 24 N= 8 Mean =16 s = = 4.2426 = 3.9686 Value for the Standard Deviation islargerfor data considered as aSample.
Comparing Standard Deviations Data A Mean = 15.5 s = 3.338 11 12 13 14 15 16 17 18 19 20 21 DataB Mean = 15.5 s =.9258 11 12 13 14 15 16 17 18 19 20 21 Data C Mean = 15.5 s =4.57 11 12 13 14 15 16 17 18 19 20 21
Coefficient of Variation • Measure ofRelative Variation • Always a% • Shows Variation Relative to Mean • Used toCompare 2 or More Groups • Formula ( for Sample):
Comparing Coefficient of Variation • Stock A:Average Price last year =$50 • Standard Deviation= $5 • Stock B:Average Price last year= $100 • Standard Deviation =$5 Coefficient of Variation: Stock A:CV= 10% Stock B:CV= 5%
Shape • Describes How Data Are Distributed • Measures of Shape: • Symmetric or skewed Right-Skewed Left-Skewed Symmetric Mean Median Mode Mean = Median = Mode Mode Median Mean
Box-and-Whisker Plot • Graphical Display of Data Using 5-Number Summary X Q Median Q X smallest 1 3 largest 12 4 6 8 10
Distribution Shape & Box-and-Whisker Plots Left-Skewed Symmetric Right-Skewed Q Median Q Q Median Q Q Median Q 1 3 1 3 3 1