Download
1 / 1
10 likes | 109 Views
PREDICTORS OF FIELDING PERFORMANCE IN PROFESSIONAL BASEBALL PLAYERS.

E N D
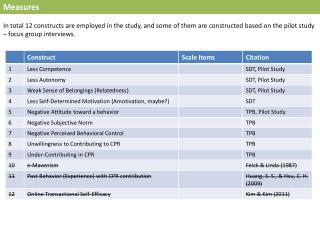
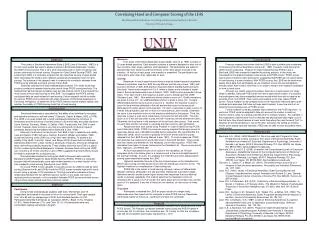
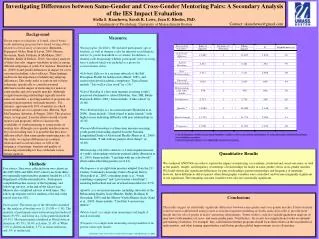
PREDICTORS OF FIELDING PERFORMANCE IN PROFESSIONAL BASEBALL PLAYERS. Gerald T. Mangine1, Jay R. Hoffman, FACSM1, Adam R. Jajtner1, Adam M. Gonzalez1, William P. McCormack1, Adam J. Wells1, Jeremy R. Townsend1, Nadia S. Emerson1, Edward H. Robinson, IV1, Jose Vazquez2, Napoleon Pichardo2, Maren S. Fragala1, Jeffrey R. Stout, FACSM1. 1Institute of Exercise Physiology and Wellness, University of Central Florida, Orlando, FL ; 2Texas Rangers Baseball Club, Arlington, TX. ABSTRACT RESULTS SUMMARY & PRACTICAL APPLICATIONS METHODS BACKGROUND: Fielding performance is difficult to assess, as traditional measures of fielding percentage (FPCT) and range factor (RF) do not take into account in-game activity. The ultimate zone rating extrapolation (UZR/150) rates fielding performance by runs saved or cost within a zone of responsibility, in comparison to the league average (150 games) for a position. Spring training anthropometric and performance measures have been previously related to hitting performance, however their relationships with UZR/150, FPCT, and RF are unknown. PURPOSE:Examine the relationship between anthropometric and performance measurements on fielding performance in professional baseball players. METHODS: Body composition [3-site skinfold (chest, abdomen, and thigh)] and performance measurements (grip strength, 10-yard sprint, pro-agility, and vertical jump) were collected during spring training over the course of five seasons (2007-11) for professional corner infielders (CI; n=17, fielding opportunities=420.7±307.1), middle infielders (MI; n=14, fielding opportunities=497.3±259.1), and outfielders (OF; n=16, fielding opportunities=227.9±70.9). The relationships between these data and regular season (100-opportunity minimum) fielding statistics were examined using Pearson correlation coefficients and stepwise regression analyses. RESULTS: Significant correlations were observed between UZR/150 and body mass (r=0.364, p=0.012), LBM (r=0.396, p=0.006), VJPP (r=0.397, p=0.006)), and VJMP (r=0.405, p=0.005). Of these variables, stepwise regression indicated VJMP (R=0.405, SEE=14.441, p=0.005) as the single best predictor for all players, though the addition of pro-agility performance strengthened (R=0.496, SEE=13.865, p=0.002) predictive ability by 8.3%. The best predictor for UZR/150 was body mass for CI (R=0.519, SEE=15.364, p=0.033) and MI (R=0.672, SEE=12.331, p=0.009), while pro-agility time was the best predictor for OF (R=0.514, SEE=8.850, p=0.042). Relationships with FPCT and RF varied among all players and position. CONCLUSIONS: Spring training measurements of VJMP and pro-agility time may predict the defensive run value of a player over the course of a professional baseball season. Subjects Table 2.Selected bivariate correlations between fitness components and measures of fielding performance by defensive category. • SUMMARY • Possessing a greater vertical jump mean power (VJMP) and a lower pro-agility time are the best predictors of a fielder’s ability to routinely make outs of baseballs hit in play and save runs from being scored. • Greater lower-body power may expand the coverage range in which a fielder may successfully make plays, and be related to greater throwing ability8. • The predictive ability of pro-agility performance confirms previous research indicating agility as a desired trait in fielders5, and appears to be most valuable to outfielders. • Greater body mass and lean body mass also appeared to be significantly (p<0.05) correlated with the ability to save runs for infielders. Body fat percentage was not significantly correlated. • Lower-body power was not related to elite fielding performance in middle infielders. This might suggest a minimum power standard required to play shortstop and second base, which is similar to what is seen as professional baseball players age6. • The traditional measurements of fielding performance, FPCT and RF, did not produce consistent results for all players or across positions, which is likely related to the insensitivity of the two measurements. • PRACTICAL APPLICATIONS • Athletes and coaches should focus on developing and maintaining agility and power which appear to be the best predictors of elite baseball fielding performance. • Body mass appears to be particular y important for infielders • Pro-agility time was the best predictor for outfielder fielding performance. • Spring training measurements of LBM, vertical jump power, and pro-agility run may be the best predictors of season-long value in runs a position player is defensively worth (UZR/150). • Strength coaches and team managers may find this information useful in the early identification of those players who are most capable of contributing to team fielding performance or the need to improve agility and power. • Twenty-two (n=22) professional baseball players from the Texas Rangers professional baseball organization during the 2007 – 2011 seasons were examined. • A minimum of 100 opportunities (i.e. putouts, assists, and errors) per season to make a defensive play within a defensive category was required. • Three defensive categories of positions, based upon similar positional demands, were used for analysis: • Corner infielders (first basemen and third basemen) (CI; n = 17, innings = 617.5 ± 358, fielding opportunities = 420.7 ± 307.1) • Middle infielders (second basemen and shortstops) (MI; n = 14, innings = 918.6 ± 474.3, fielding opportunities = 497.3 ± 259.1) • Outfielders (OF; n = 16, innings = 868.7 ± 220.8, fielding opportunities = 227.9 ± 70.9). • Pitchers and catchers were excluded from the analysis due to the unique defensive demands of their respective positions and because they did not complete the same spring training performance measures. Table 1.Anthropometric and Performance Comparisons INTRODUCTION • Circumstantial variables occurring during a baseball game will affect a defensive player’s value according to traditional measures of fielding performance (i.e. Fielding Percentage [FPCT] and Range Factor [RF]). • The Ultimate Zone Rating extrapolation (UZR/150) accounts for these variables and values a fielder in terms of runs stopped (positive) or allowed (negative) in comparison to the league average at a position seen over 150 games7. • Anthropometric and performance measures collected during spring training have been related to hitting performance3, but their relationships with UZR/150, FPCT, or RF are unknown. THE SINGLE BEST PREDICTORS REFERENCES Brozek J, Grande F, Anderson JT, Keys A. Densitometric Analysis of Body Composition: Revision of Some Quantitative Assumptions. Ann N Y Acad Sci. Sep 26 1963;110:113-140. Harman E, Rosenstein M, Frykman P, Rosenstein R, Kraemer W. Estimation of human power output from vertical jump. Journal of Applied Sport Science Research 1991;5:116-120. Hoffman JR, Vazquez J, Pichardo N, Tenenbaum G. Anthropometric and performance comparisons in professional baseball players. J Strength Cond Res. Nov 2009;23(8):2173-2178. Jackson AS, Pollock ML. Generalized equations for predicting body density of men. Br J Nutr. Nov 1978;40(3):497-504. Kohmura Y, Aoki K, Yoshigi H, Sakuraba K, Yanagiya T. Development of a baseball-specific battery of tests and a testing protocol for college baseball players. J Strength Cond Res. Jul 2008;22(4):1051-1058. Mangine GT, Hoffman JR, Fragala MS, et al. Effect of Age on Anthropometric and Physical Performance Measures in Professional Baseball Players. J Strength Cond Res. Apr 10 2012. Piette III JM. Estimating fielding ability in baseball players over time, University of Pennsylvania; 2011. Spaniol FJ. Baseball Athletic Test: A Baseball-Specific Test Battery. Strength & Conditioning Journal. 2009;31(2):26-29 10.1519/SSC.1510b1013e31819d31813af31818. Regression Analysis of the Ultimate Zone Rating/150 All Players: VJMP (R=0.405, SEE=14.441, p=0.005) • VJMP + Pro-Agility (R=0.496, SEE=13.865, p=0.002) improved predictive ability by 8.3%. Infielders: Body Mass (CI: R=0.519, SEE=15.364, p=0.033; MI: R=0.672, SEE=12.331, p=0.009). Outfielders: Pro-agility time (R=0.514, SEE=8.850, p=0.042) Regression Analysis of Fielding Percentage All players: Height (R=0.296, SEE=0.012, p=0.043) Corner Infielders: Age (R=0.512, SEE=0.016, p=0.035) Outfielders: Maximal grip strength (R=0.527, SEE=0.242, p=0.036) Middle Infielders: None Regression Analysis of Range Factor All players: BF% (R=0.313, SEE=2.441, p=0.032) • BF% + Age (R=0.469, SEE=2.296, p=0.004) improved predictive ability by 12.2%. Corner Infielders: Age (R=0.544, SEE=2.556, p=0.024) Outfielders: 10-yard sprint time (R=0.527, SEE=0.242, p=0.036) Middle Infielders: None • Measures • De-identified data from required spring training measurements were provided by the team NSCA certified strength coaches (CSCS) for analysis. • Anthropometric and Performance variables included: • Body Composition determined from 3-site (chest, abdomen, and thigh) skinfold1,4 • Vertical Jump power determined from Harman Formula2 • 10-yard sprint speed and Pro-agility Drill (5 – 10 – 5 sprint) • Maximal grip strength (Sammons Preston, Bolingbrook, IL, USA) • Statistical Analysis included: • One-way analysis of variance (ANOVA) for differences between defensive categories • Pearson product moment correlations to examine relationships between performance data and defensive statistics (FPCT, RF, and UZR/150) for all players and by defensive category. • Stepwise regression to determine the contribution of each variable. Figure 1. The field of play is broken up into 78 zones of responsibility used for calculation of UZR/150. The fourteen furthest from home plate not included in the calculation. PURPOSE The purpose of this investigation was to identify the anthropometric and physiological variables that may predict fielding performance across defensive positions in professional baseball.