Download
1 / 45
450 likes | 569 Views
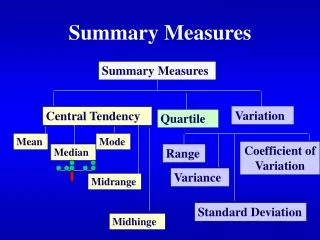
Data Summary Using Descriptive Measures. Introduction to Business Statistics, 5e Kvanli/Guynes/Pavur (c)2000 South-Western College Publishing. Types of Descriptive Measures. Central Tendency Variation Position Shape. Introduction to Business Statistics, 5e Kvanli/Guynes/Pavur

E N D
Data SummaryUsing Descriptive Measures Introduction to Business Statistics, 5e Kvanli/Guynes/Pavur (c)2000 South-Western College Publishing
Types of Descriptive Measures • Central Tendency • Variation • Position • Shape Introduction to Business Statistics, 5e Kvanli/Guynes/Pavur (c)2000 South-Western College Publishing
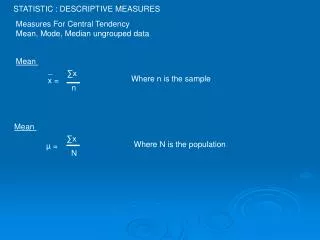
Measures of Central Tendency • Mean • Median • Midrange • Mode Introduction to Business Statistics, 5e Kvanli/Guynes/Pavur (c)2000 South-Western College Publishing
The Mean The Mean is simply the average of the data. Introduction to Business Statistics, 5e Kvanli/Guynes/Pavur (c)2000 South-Western College Publishing
Sample Mean Each value in the sample is represented by x thus to get the mean simply add all the values in the sample and divide by the number of values in the sample Introduction to Business Statistics, 5e Kvanli/Guynes/Pavur (c)2000 South-Western College Publishing
Accident Data Set Introduction to Business Statistics, 5e Kvanli/Guynes/Pavur (c)2000 South-Western College Publishing
The Median The Median (Md) of a set of data is the value in the center of the data values when they are arranged from lowest to highest. Introduction to Business Statistics, 5e Kvanli/Guynes/Pavur (c)2000 South-Western College Publishing
Accident Data Ordered array: 5, 6, 7, 9, 23 The value that has an equal number of items to the right and left is the median. Thus Md = 7 Introduction to Business Statistics, 5e Kvanli/Guynes/Pavur (c)2000 South-Western College Publishing
The Median In general if n is odd, Md is the center data value of the ordered data set. Introduction to Business Statistics, 5e Kvanli/Guynes/Pavur (c)2000 South-Western College Publishing
Accident Data æ 5 + 1 ö Md = st ordered value = 3rd value ç ÷ è ø 2 Ordered array: 5, 6, 7, 9, 23 Introduction to Business Statistics, 5e Kvanli/Guynes/Pavur (c)2000 South-Western College Publishing
The Median If n is even, Md is the average of the two center values of the ordered data set. For the ordered data set: 3, 8, 12, 14 æ 8 + 12 ö Md = = 10.0 ç ÷ è ø 2 Introduction to Business Statistics, 5e Kvanli/Guynes/Pavur (c)2000 South-Western College Publishing
The Midrange The Midrange (Mr) provides an easy-to-grasp measure of central tendency. Introduction to Business Statistics, 5e Kvanli/Guynes/Pavur (c)2000 South-Western College Publishing
Accident Data 5 + 23 Mr = = 14.0 2 Note: that the Midrange is severely affected by outliers Compare: Md = 7 x = 10 Introduction to Business Statistics, 5e Kvanli/Guynes/Pavur (c)2000 South-Western College Publishing
The Mode The Mode (Mo) of a data set is the value that occurs more than once and the most often. The Mode is not always a measure of central tendency; this value need not occur in the center of the data. Introduction to Business Statistics, 5e Kvanli/Guynes/Pavur (c)2000 South-Western College Publishing
Level of Measurement and Measure of Central Tendency Introduction to Business Statistics, 5e Kvanli/Guynes/Pavur (c)2000 South-Western College Publishing
Measures of Variation • Homogeneity refers to the degree of similarity within a set of data. • The more Homogeneous a set of data is, the better the mean will represent a typical value. • Variation is the tendency of data values to scatter about the mean, . x Introduction to Business Statistics, 5e Kvanli/Guynes/Pavur (c)2000 South-Western College Publishing
Common Measures of Variation • Range • Variance • Standard Deviation • Coefficient of Variation Introduction to Business Statistics, 5e Kvanli/Guynes/Pavur (c)2000 South-Western College Publishing
The Range For the Accident data: Range = H - L = 23 - 5 = 18 Introduction to Business Statistics, 5e Kvanli/Guynes/Pavur (c)2000 South-Western College Publishing
The Variance and Standard Deviation Both measures describe the variation of the values about the mean. Introduction to Business Statistics, 5e Kvanli/Guynes/Pavur (c)2000 South-Western College Publishing
Accident Data Data Value (x - ) (x - )2 5 -5 25 6 -4 16 7 -3 9 9 -1 1 23 13 169 = 220 x x 2 å x ( x – ) Introduction to Business Statistics, 5e Kvanli/Guynes/Pavur (c)2000 South-Western College Publishing
Definition: Sample Variance Introduction to Business Statistics, 5e Kvanli/Guynes/Pavur (c)2000 South-Western College Publishing
Definition: Sample Standard Deviation s = 55 . 0 = 7 . 416 Introduction to Business Statistics, 5e Kvanli/Guynes/Pavur (c)2000 South-Western College Publishing
Definition:Population Variance Introduction to Business Statistics, 5e Kvanli/Guynes/Pavur (c)2000 South-Western College Publishing
Definition:Population Standard Deviation 2 ( x – m ) å s = N Introduction to Business Statistics, 5e Kvanli/Guynes/Pavur (c)2000 South-Western College Publishing
The Coefficient of Variation The Coefficient of Variation (CV) is used to compare the variation of two or more data sets where the values of the data differ greatly. Introduction to Business Statistics, 5e Kvanli/Guynes/Pavur (c)2000 South-Western College Publishing
Example Data Set 1: 5, 6, 7, 9, 23 Data Set 2: 5000, 6000, 7000, 9000, 23,000 7.416 . = 74.16 Data Set 1 CV = 100 10 7,416 . = 74.16 Data Set 2 CV = 100 10,000 Thus both data sets exhibit the same relative variation Introduction to Business Statistics, 5e Kvanli/Guynes/Pavur (c)2000 South-Western College Publishing
Measures of Position • Percentile (Quartile) • Z Score Introduction to Business Statistics, 5e Kvanli/Guynes/Pavur (c)2000 South-Western College Publishing
Percentile The 35th Percentile (P35) is that value such that at most 35% of the data values are less than P35 and at most 65% of the data values are greater than P35 . Introduction to Business Statistics, 5e Kvanli/Guynes/Pavur (c)2000 South-Western College Publishing
PercentileTexon Industries Data 17.5 represents the position of the 35th percentile Introduction to Business Statistics, 5e Kvanli/Guynes/Pavur (c)2000 South-Western College Publishing
Percentile: Location Rules • If n P/100 is not a counting number, round it up, and the Pth percentile will be the value in this position of the ordered data. • If n P/100 is a counting number, the Pth percentile is the average of the number in this location (of the ordered data) and the number in the next largest location. Introduction to Business Statistics, 5e Kvanli/Guynes/Pavur (c)2000 South-Western College Publishing
Quartiles Quartiles are merely particular percentiles that divide the data into quarters, namely: • Q1 = 1st quartile = 25th percentile (P25) • Q2 = 2nd quartile = 50th percentile (P50) • Q3 = 3rd quartile = 75th percentile (P75) Introduction to Business Statistics, 5e Kvanli/Guynes/Pavur (c)2000 South-Western College Publishing
Z Scores • Z score determines the relative position of any particular data value x and is based on the mean and standard deviation of the data set. • The Z score is expresses the number of standard deviations the value x is from the mean. • A negative Z score implies that x is to the left of the mean and a positive Z score implies that x is to the right of the mean. Introduction to Business Statistics, 5e Kvanli/Guynes/Pavur (c)2000 South-Western College Publishing
Z Score Equation Introduction to Business Statistics, 5e Kvanli/Guynes/Pavur (c)2000 South-Western College Publishing
Measures of Shape • Skewness • Kurtosis Introduction to Business Statistics, 5e Kvanli/Guynes/Pavur (c)2000 South-Western College Publishing
Skewness Skewness measures the tendency of a distribution to stretch out in a particular direction Introduction to Business Statistics, 5e Kvanli/Guynes/Pavur (c)2000 South-Western College Publishing
Skewness • In a symmetrical distribution the mean, median, and mode would all be the same value. Sk = 0 (fig 3.7) • A positive Sk number implies a shape which is skewed right (fig3.8). The mode < median < mean • In a data set with a negative Sk value (fig3.9) the mean < Median < Mode Introduction to Business Statistics, 5e Kvanli/Guynes/Pavur (c)2000 South-Western College Publishing
Figure 3.7 Introduction to Business Statistics, 5e Kvanli/Guynes/Pavur (c)2000 South-Western College Publishing
Figure 3.8 Introduction to Business Statistics, 5e Kvanli/Guynes/Pavur (c)2000 South-Western College Publishing
Figure 3.9 Introduction to Business Statistics, 5e Kvanli/Guynes/Pavur (c)2000 South-Western College Publishing
Skewness Calculation Introduction to Business Statistics, 5e Kvanli/Guynes/Pavur (c)2000 South-Western College Publishing
Kurtosis Kurtosis measures the peakedness of the distribution. Introduction to Business Statistics, 5e Kvanli/Guynes/Pavur (c)2000 South-Western College Publishing
Chebyshev’s Inequality • At least 75% of the data values are between x - 2s and x + 2s or At least 75% of the data values have a Z score value between -2 and +2 • At least 89% of the data values are between x - 3s and x + 3s • In general, at least (1-1/k2) x 100% of the data values lie between x - ks and x + ks for any k>1 Introduction to Business Statistics, 5e Kvanli/Guynes/Pavur (c)2000 South-Western College Publishing
Empirical Rule • Under the assumption of a bell shaped population • Approximately 68% of the data values lie between • Approximately 95% of the data values lie between • Approximately 99.7% of the data values lie between Introduction to Business Statistics, 5e Kvanli/Guynes/Pavur (c)2000 South-Western College Publishing
Chebyshev’s versus Empirical Introduction to Business Statistics, 5e Kvanli/Guynes/Pavur (c)2000 South-Western College Publishing
Grouped DataApproximations Where: f is the frequency of the class and m is the m is the midpoint of the class Introduction to Business Statistics, 5e Kvanli/Guynes/Pavur (c)2000 South-Western College Publishing