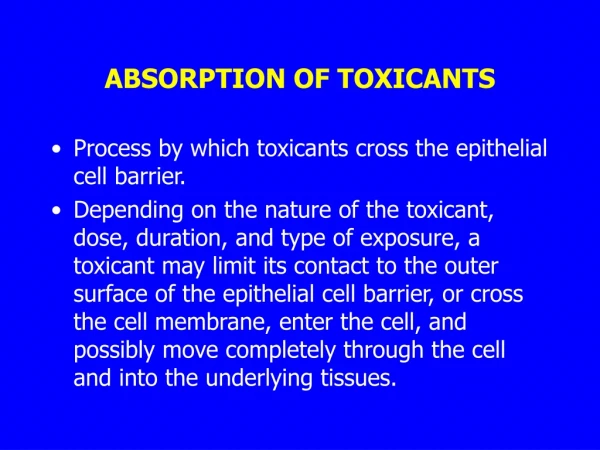
Download
1 / 20
200 likes | 305 Views
Monitoring of toxicants in the surface water in Poland. Ewa Szalińska Cracow University of Technology , Poland. curriculum in natural environmental science, 2005. Contents:. Monitoring of the aquatic environment in Poland Water quality legislation Toxicants in legislation acts

E N D
Monitoring of toxicants in the surface water in Poland Ewa Szalińska Cracow University of Technology, Poland curriculumin natural environmental science, 2005
Contents: • Monitoring of the aquatic environment in Poland • Water quality legislation • Toxicants in legislation acts • Toxicants in monitoring practice • The upper Dunajec watershed as an example of surface water monitoring • Conclusions curriculumin natural environmental science, 2005
The Polish State Monitoring System The Polish State Monitoring System air, water, waste, soils, radiation, noise, nature, forests Quality of Environment air, water, waste Emission Assessments & Forecasts curriculumin natural environmental science, 2005
Map of Poland area: 312,000 km2 population: 38,5 millions curriculumin natural environmental science, 2005
Surface water monitoring Diagnostic monitoring Operational monitoring Monitoring of water sensitive to eutrophication Monitoring of water quality in respect of protection fish, crustaceans and molluscs existence curriculumin natural environmental science, 2005
The monitoring network for running water quality curriculumin natural environmental science, 2005
Surface water quality classes Class I – very good quality Class II – good quality Class III – satisfactory quality Class IV – unsatisfactory quality Class V – poor quality curriculumin natural environmental science, 2005
Measured toxicants cyanide, fluoride Inorganic substances Metals and metalloids Organic contaminants As,Ba, B, Crtot, Cr+6,Zn, Al, Cd, Mn, Cu, Ni, Pb, Hg, Se, Fe phenols, pesticide, mineral oils, anion-active detergents, PAH curriculumin natural environmental science, 2005
Permissible levels of selected toxicants curriculumin natural environmental science, 2005
Map of the upper Dunajec watershed curriculumin natural environmental science, 2005
The Czorsztyn reservoir curriculumin natural environmental science, 2005
Localisation of sampling sites in the Czorszyn reservoir watershed curriculumin natural environmental science, 2005
Cl concentration (1994) at sampling site 2 Symbols described in the legend: total 24 samples and samples selected for subsets of n =12 , 6, and 4. Horizontal lines show mean concentration calculated from all 24 samples and the subsets curriculumin natural environmental science, 2005
Mean annual Cl concetrations at sampling site2 with the confidence intervals at probability level 0.95. Means determined from the sets of 4, 6, 12 and 24 samples. curriculumin natural environmental science, 2005
Cr concentrations atsampling site 1 in 2001 determined by the State Monitoring (n=4) and the CUT (n=12) curriculumin natural environmental science, 2005
Chromium in the Dunajec river The State Monitoring CUT 2, 3 4 times a year non-calibrated filters FAAS Cr tot sections sampling filtration method determination 1, 2, 3 once a month 0,45 m CAdSV Cr tot, Cr+6 curriculumin natural environmental science, 2005
Cr concentrations in the upper Dunajec catchment Crtot [mg/l] 100 100 89.2 50 42.2 50 9.0 nd 2.0 3.0 CUT The State Monitoring curriculumin natural environmental science, 2005
Total Cr concentrations in the Dunajec river(monthly average) in 2001 curriculumin natural environmental science, 2005
Conclusions: • Detailed identification of water pollution local problems • Adaptation of the monitoring programmes to local needs • Evaluation of the effectiveness of management actions • Updating the list of toxicants to be monitored (especially organic micro-pollutants) curriculumin natural environmental science, 2005
References: Biblioteka Monitoringu Środowiska, Reports on the enviornment status and trends, http://www.pios.gov.pl/ Ministry of the Environment, Ordinances on environmental protectionhttp://www.mos.gov.pl/ The State of Environment in Poland 1996–2001 Report, Warsaw 2003 Szalińska, E. 2001 Jakość powierzchniowych wód płynących w zlewni górnego Dunajca w latach 1995-1998. Gospodarka Wodna, 3, 114-8 Szalińska, E., 2002 Transformation of chromium in the water environment contaminated with tannery wastewater. Monographs of Politechnika Krakowska (CUT), Environmental Engineering issue, 283. http://www.zzw-niedzica.com.pl curriculumin natural environmental science, 2005