Download
1 / 45
470 likes | 869 Views
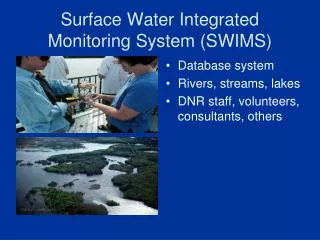
Surface Water Quality Monitoring Information System (SWQMIS) . Cindi Atwood Tetra Tech, Inc. (703) 385-6000 cynthia.atwood@tetratech.com. Nancy Ragland TCEQ (512) 239-6546 NRagland@tceq.state.tx.us. TCEQ’s New Enterprise Data System for Managing Ambient Water Quality Data . Benefits.

E N D
Surface Water Quality Monitoring Information System (SWQMIS) Cindi Atwood Tetra Tech, Inc. (703) 385-6000 cynthia.atwood@tetratech.com Nancy Ragland TCEQ (512) 239-6546 NRagland@tceq.state.tx.us
TCEQ’s New Enterprise Data System for Managing Ambient Water Quality Data
Benefits • Consolidate and centralize data • Increase data consistency and integrity • Assist your agency with internal and external data requests • Help management to turn around urgent, high priority requests quickly • Save time and money
One Week vs One Day • 44 Hours down to 8 Hours • 2 person task down to a 1 person task
System Deployment • Deployed the system successfully in early 2007 • Developed the system as: • Web-based • J2EE and Oracle • Integrated the system with web-based GIS functionalities using ESRI ArcIMS and ArcSDE
Core System Modules • Monitoring Stations • Equipment • Geographical Areas • Constituents • Sampling • Comparison Information • Projects • Reports and Extracts • Maps (GIS) • Assessment • Administration
Manage Ambient Water Quality Data • Organize data in a way that enhances business processes • Protect data integrity through clean system design • Involve stakeholders at all levels of organization in design and test • Keep system flexible to meet future needs
Consolidate & Centralize Databases • Allow core data submittal from various data owners • Consolidate and centralize databases containing : • Field measurements • Toxics and organics in a variety of media • Biological • Habitat parameters, etc. • Spatial data
Various Data Sources • Supply custom interfaces for manual entry • Administrators • Data Managers • Field Personnel • Assessors • Provide mass data loaders for various data sources including • Continuous data from data loggers • LIMS • USGS • River and municipal authorities in Texas
Data Integrity • Provide custom interfaces for manual entry • Enforce consistent data entry of all types of data • Typographical errors • Outlier checks • Validate data from manual and mass loaded data • Review of submitted data by data managers to approve or deny
Mass Loaded Data Validation • The automated validation checks are all run, without stopping after the first “failure.” In this way, a complete list of errors can be shown. • Over 50 validation checks run on mass loaded data • Check for outliers. Check measurements against predefined ranges (min/max). Compares verify flag in the Results file to see if the outlier value has already been verified by the collector. • If sample collected when raining or has rained within the last 24 hours, report a value of <1. In other words, is days since precipitation (72053) < 1? • Check for duplicates in data set based on station ID, sample date, sample time, and parameter code.
GIS Integration • Allow map-based creation of sites • Automatically assign geographic attributes such as basin, county and ecoregion to a site • Provide map-based search and reporting features • Synchronize geographic data with tabular data
Public Access • Allow the public and other organizations to retrieve water quality data
Public Access – Drill Down 100 x 100 Mile Square
Public Access – Drill Down 25 x 25 Mile Square
Public Access – Drill Down 6.25 x 6.25 Mile Square
Reports & Data Extractions • Avaliable in: • HTML • CSV (Comma Separated Values) • Pipe delimited “|” (text) format
Reports & Data Extractions Station Inventory Report
Reports & Data Extractions Sampling History Report
Assessments • Integrates SWQMIS with the statistical SAS tools in order to: • Summarize data • Calculate various statistics • Provide reports for assessors
Assessments – Business Logic • Identify and convert preferred parameters to correct units • Handle profile samples appropriately • Identification of the mixed surface layer • Summarize data and calculate statistics • Mean, geometric mean, median, standard deviation, percentiles, confidence intervals
Assessments – Business Logic (cont.) • Determine appropriate criteria and identify exceedances • Basin-specific • Segment-specific • Site-specific • Formulas (acute & chronic metals) • Ascertain waterbody’s support status • Provide full documentation for all steps of the process
Data Flow • Transfer of core data to EPA automatically on a periodic basis through web services and the Central Data Exchange (CDX via the Water Quality Exchange (WQX)
Data Flow • Actively flowing data to the EPA since September, 2007 • Fully automated process • Currently transfer physical and chemical data • Will transfer biological data at a later date
Administration • Track the “history” of data changes • Provide interfaces that allow a database administrator to manage: • Users • Security • Reference data
Lessons Learned • Allow design time that is adequate for the scope • Employ tried technology • Use agile development techniques • Start third party integration communication and testing early