Download
1 / 33
340 likes | 530 Views
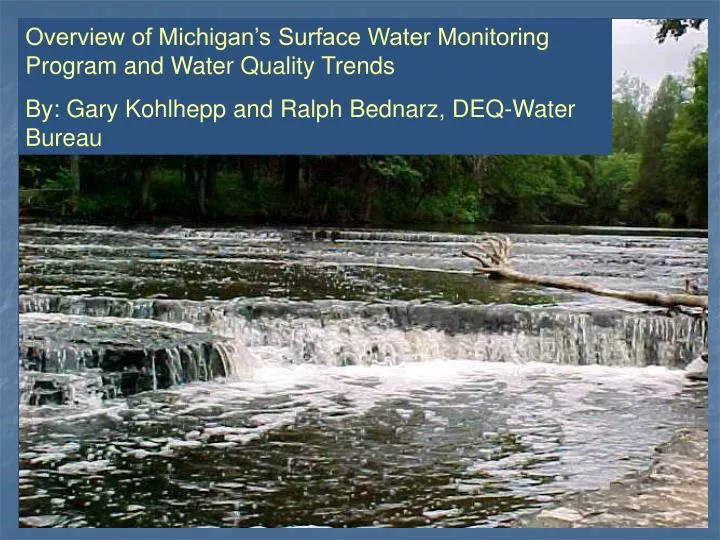
Overview of Michigan’s Surface Water Monitoring Program and Water Quality Trends By: Gary Kohlhepp and Ralph Bednarz, DEQ-Water Bureau. Monitoring Strategy. Completed in January 1997 Identified a comprehensive list of monitoring activities with cost estimates

E N D
Overview of Michigan’s Surface Water Monitoring Program and Water Quality Trends By: Gary Kohlhepp and Ralph Bednarz, DEQ-Water Bureau
Monitoring Strategy • Completed in January 1997 • Identified a comprehensive list of monitoring activities with cost estimates • Implementation primarily through grants and contracts • Updated in 2004/2005 per EPA requirements • Includes sections on objectives, study design, indicators, quality assurance, data analysis, data management, reporting, program review, and existing/needed infrastructure
Four Monitoring Goals • Assess the current status and condition of individual waterbodies and determine whether MI Water Quality Standards are being met • Measure temporal and spatial water quality trends • Provide data to support DEQ water quality protection programs and evaluate their effectiveness • Detect new and emerging water quality problems
Funding Increase For Water Quality Monitoring From the Clean Michigan Initiative Millions
Water Quality Monitoring Program Elements • Water Chemistry • Sediment Chemistry • Fish Contaminants • Biological Integrity & Physical Habitat • Wildlife Contaminants • Beach Monitoring • Inland Lake Quality • Volunteer Monitoring • Stream Flow
Water Chemistry • 5-year basin surveys • Fixed station trends • Statewide random sampling • CREP monitoring, TMDLs, other special studies (esp. non-point source effectiveness) • Local water quality monitoring and emerging issue monitoring grants ($200,000 each)
Sediment Chemistry – Inland Lake Trends • 35-40 lakes to be sampled • 27 lakes sampled through 2004 • Provides long-term record of contaminants
TakingSediment Replicates Large TubesPortableHigh quality 210Pb, pore waterorganics, metals
2001 recent time old 1500 Chemical Sediment Chronologies Elk Lake The use of sediments in lakes as a “tape recorder” of changes in chemical loadings to the environment.
Sediment Cores Cass Lake Elk Lake
Sediment Trend Lakes 1 1999 # 2000 # 2001 # 2002 3 # 2 4 # 2003 # # 28 2004 1. Gratiot Lake 2. Imp Lake 3. Witch Lake 4. Round Lake 5. Burt / Mullett Lake 6. Crystal Lake (Benzie Co.) 7. Elk Lake 8. Torch Lake 9. Hubbard Lake 10. Lake Cadillac 11. Higgins Lake 12. Houghton Lake 13. Littlefield Lake 14. Crystal Lake (Montcalm Co.) 15. Paw-Paw Lake 16. Gull Lake 17. Whitmore Lake 18. Cass Lake 19. Muskegon Lake 20. Birch Lake 21. Sand Lake 22. Avalon Lake 23. Shupac Lake 24. Lake George 25. Otter Lake 26. Crystal Lake (Montcalm Co.) 27. Hackert Lake 28. Round Lake (Delta Co.) 5 22 # 8 # 23 9 6 7 11 # 24 12 10 # 27 13 # 19 # 25 14, 26 18 16 15 17 # # 21 20
Elk Gratiot Gull Higgins
Rise in accumulation rates ~1900 significant after 1950 Importance of watershed scale sources Temporal TrendsAnthropogenic Mercury Accumulation Rates
Wildlife Contaminants • Bald eagles – began in 1999 • Herring gull eggs – began in 2001 • Analysis for bioaccumulative chemicals of concern
U % # U % S % U # # U % S S # S U # % S # % U S # S # # U % S S U # % % U S # S U % % U # S % U U % U # % S U # % # % U # S % U # S # % U S S S % U % U # # # S U # % S S S # U % S U % # S % # U S U % U # % # S S T $ # S # S U % U % U % T $ U % T $ % U T $ # # S S U % # U % S $ T U % % U T $ % U U % U % $ T T $ $ T U % $ T $ T # # S S $ T T $ # % U S T $ T $ U % % U $ T $ T T $ T $ T $ T $ U % T $ T $ $ T T $ U % $ T U T % $ T $ % U T $ % U % T $ U % U T $ T $ U % T $ $ T $ T U T % $ % U $ T U % T $ U % $ T % U % U U % U % U % $ T U % % U % U % U % U $ T $ T U % T $ U % % U % U U % U % U % U % U % % U % U U % % U % U % U % U U % % U U % % U U % % U U % U % U % U % % U U % U % % U U % $ T $ T $ T $ T T $ $ T $ T T $ $ T $ T $ T $ T $ T $ T $ T T $ T $ % U T $ $ T $ T T $ T $ T $ $ T T $ $ T $ T T $ $ T T $ $ T $ T $ T $ T $ T T $ T $ T $ T $ $ T # S T $ $ T $ T T $ $ T # # S # # S # S S # $ T S S T $ # T $ S # # # # # S S # S S S S # S # $ T $ T S $ T $ T $ T # S # T $ # S S $ T # S # S T $ T $ U % # S # S % U # S U % % U # S # S % U # S # S # S # S # S Bald Eagle Nest Locations U % % U U % % U % U % U % U U % % U % U U % U % U % U % % U U %
Lake Water Quality Assessment • Re-establish LWQA monitoring program – formerly implemented via Clean Water Act – Clean Lakes Program • Work with USGS to re-establish LWQA monitoring • USGS and MSU are evaluating satellite technology for regional and statewide lake water quality assessment
Volunteer Monitoring • FY98 through FY05: 33 grants awarded totaling $265,000 • Michigan Clean Water Corps was established in 2003 • Includes stream/river and inland lake volunteers • www.micorps.net • DEQ uses data as a “screening tool” to identify sites for follow-up assessment
Objectives Collect data that can be used by DEQ as “screening tools”. • Reach goal of 80% coverage • Assist DEQ in prioritizing sites Increase public awareness and involvement in protection and surveillance of rivers and streams.
Volunteer Training • Classroom • Safety Guidelines • Sampling Logistics & Procedures • Data Forms • Macroinvertebrate Identification • Field • Site Assessment • Habitat • Macroinvertebrates
Cooperative Lakes Monitoring Program (The Self-Help Legacy) • Program began in 1974 with water clarity (Secchi disk) monitoring – second oldest program in country • Current focus on trophic state indicators • water clarity (228 lakes) • total phosphorus • spring overturn (196 lakes) • late-summer stratification (206 lakes) • chlorophyll a (121 lakes) • dissolved oxygen and temperature (53 lakes) • aquatic plant ID and mapping (5 lakes)
CLMP Quality Data • Detailed procedures • Comprehensive training • Replicate sampling • DEQ side-by-side sampling
Additional Information • Gary Kohlhepp, 517-335-1289 (kohlhepg@michigan.gov) • Ralph Bednarz, 517-335-4211 (bednarzr@michigan.gov) • www.michigan.gov/deq, click on “Water”, click on “Water Quality Monitoring”, click on “Assessment of Michigan Waters” • www.micorps.net