Download
1 / 47
480 likes | 644 Views
BASIC SPATIAL ANALYSIS TOOLS IN A GIS. database queries basic statistics buffering overlay reclassification. GIS ANALYSIS TOOLS. GIS ANALYSIS TOOLS. Database tools : query and summarize (similar to spreadsheet or database program contains spatial component

E N D
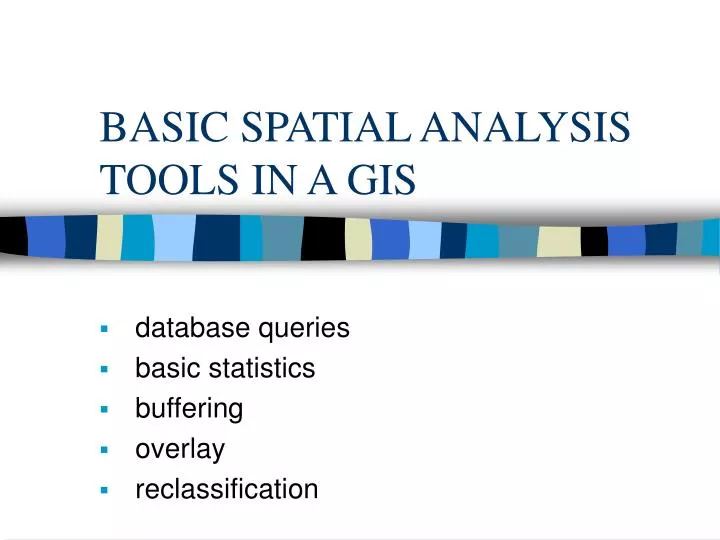
BASIC SPATIAL ANALYSIS TOOLS IN A GIS database queries basic statistics buffering overlay reclassification
GIS ANALYSIS TOOLS • Database tools: query and summarize (similar to spreadsheet or database program • contains spatial component • Grid-based: buffering, overlay and map calculator tools • Image processing and terrain analysis: based on moving window that create new maps from patterns on the original
QUERIES Ask questions about GIS databases: • Where are the older stands? • Which roads are paved? • Which trails are authorized? • Which water sources are within a certain distance of a road?
QUERIES Where are the thinnable stands? Age 30 and Age 40 Age 30 and Age 40 and MBF 30
QUERIES Structured Query Language (SQL) • uses standard operators • e.g. = > < + - * • “and” “or” “not” • standard order of operations • add/subtract before multiply/divide • use parentheses to “isolate” terms
QUERIES Example: • select stands greater than 30 acres with grass understories and a mean quadratic diameter less than 20 inches. • query for above: (area > 30) and (understory = “grass”) and (QMD < 20)
QUERIES Which water sources are within a certain distance of a road? • we need more information. • perhaps a new database layer. • “buffering” may help answer this question
BASIC STATISTICS • statistics can help determine meaning within the data • simple, sum, count, mean, maximum, range, variance and standard deviation • calculates statistics for a combination of fields, for example: • by combining the ‘State’ name field & ‘Population’ fields, we can calculate the average state population
BUFFERING • defining closed areas (polygons) within a certain distance of selected landscape features: • to identify areas surrounding geographic features • identify / select features that then fall within / outside the boundary of the buffer • provide summary measures of proximity
BUFFERING • you can buffer points, lines and polygons
BUFFERING What do the riparian buffer zones look like? How far around an owl nest location is 70 acres? What do the visually sensitive areas around trails encompass?
BUFFERING • problems may occur when buffering very convoluted lines or areas; or for large datasets • may have to increase the virtual memory of your system • or break the job up into a number of smaller pieces
BUFFERING Site selection • determine location of new well – make sure it does not fall within 10km of chemical factories • find all stream segments within 300 feet of a proposed logging area
BUFFERING Environmental pollution • zone of noise pollution around major roads • buffers around contaminated land to prioritise sites (according to land use, water courses & ground water protection zones)
BUFFERING Resource management / Planning • service zones (e.g. 2,000 m around recycling centres) • create protection zones around features (e.g. nature reserves) • e.g. Bus routes
BUFFERING Epidemiology • disease clusters around certain features (e.g. asthma surrounding incinerators) Crime • to examine if car crime is more prominent in certain areas (e.g. close to major roads, street corners, car parks)
OVERLAY • processes involving two (or more) layers • merging is a simple overlay process that combines two or more layers into one. It leaves overlapping regions and does not create new attributed polygons where there is overlap. • three overlay processes are considered here: • Union • Intersect • Identity • in contrast to a simple merge, each of these operations will produce a new layer with unique combinations of the input database polygons.
OVERLAY Laying one GIS database on another to produce a combination of the two. Union: • determining the combination of two GIS databases. • resulting GIS database will extend as far as both input • GIS databases extend
Input GIS database #1 Output GIS database Input GIS database #2 OVERLAY Union: What is the combination of the stands and the fire area?
OVERLAY • Laying one GIS database on another to produce a combination of the two • Intersect: • finding the overlapping areas between two GIS databases
Input GIS database #1 Output GIS database Input GIS database #2 OVERLAY Intersect: Where do the stands and the fire area overlap?
OVERLAY • Laying one GIS database on another to produce a combination of the two. • Identity: • determining how one GIS database can be modified by the position of features in another. • limited to the spatial extent of the first GIS database.
Input GIS database #1 Output GIS database Input GIS database #2 OVERLAY Identity: Where does the fire occur in the stands database?
BOOLEAN OPERATORS • Definitions • to retrieve geographical data • essential part of most GIS projects • Usages • to retrieve geographical data • to check the quality of data and the results obtained (i.e. hotels in the sea after digitising or data conversion) • Boolean operators • A AND B, A OR B, A NOT B, A XOR B, (A AND B) OR C, A AND (B OR C)
BOOLEAN OPERATORS • 1 = ‘true’ 0 = ‘false’
BOOLEAN OPERATORS • Venn diagrams
OVERLAY TYPES - VECTOR Point in Polygon • overlay point objects on areas, compute "is contained in" relationship • points a,b,c...n, are contained within polygon x • result is a new attribute for each point in the database
OVERLAY TYPES - VECTOR Line on Polygon • overlay line objects on area objects • compute "is contained in" relationship • lines are broken at each area object boundary • containing area is new attribute of each output line
OVERLAY TYPES - VECTOR Polygon on Polygon • overlay two layers of area objects • boundaries are broken at each intersection • number of output areas likely to be greater than the total number of input areas • after overlay we can recreate either of the input layers by dissolving and merging based on the attributes contributed by the input layer
OVERLAY TYPES - RASTER • very fast and easy compared to vector overlay • extent of calculations is much less • cell-by-cell basic • new cells are assigned attributes composed from original cells • condition: both layers have identical geometry • quantitative or qualitative overlay • less flexibility with attributes
OVERLAY TYPES - RASTER • raster maps treated as arrays of numbers to be added, subtracted, etc.
OVERLAY TYPES - RASTER High slope (red) + Private land (blue) = Potential areas for a ski resort (brown)
OVERLAY TYPES - RASTER Map Algebra operators • arithmetic operators: +, -, *, /, ^, • grid2 = grid0 + grid1 • logical operators, =, >, <, >=, <=, <>, etc. • grid2 = grid0 > grid1 (grid2 becomes 1 where this is true, 0 where false) • mathematical functions (trigonometric, logorithms, etc.) • grid2 = sin(grid1) • best raster systems allow multiple input grids • grid5 = grid1 * ( grid2 + grid3 - grid4 ) • Saves calculating and storing intermediate grids
RECLASSIFICATION • input is result of classification • grouping of attributes according to limits with no change in geometry • results usually in a lower number of classes • aim: • to remove detail to emphasize spatial patterns • visualize new pattern and connections • transformation from one classification system to another (e.g. soil types to agricultural land use suitability)
Low Income Group Middle Income Group High Income Group RECLASSIFICATION Household Income 0 – 5000 5000 – 10,000 10,000 – 20,000 20,000 – 40,000 40,000 – 60,000 50,000 – 75,000 > 75,000
RECLASSIFICATION • results usually in a lower number of classes
NETWORK ANALYSIS • movement or distribution of resources across a connected network or arcs. • routing • optimum path between two locations • allocating • maximize capacity at a facility • e.g. assign streets to fire stations • address Matching • locate street address along an arc based on address
SURFACE ANALYSIS • three dimensional analysis (x,y,z) • lattice or TIN (Triangulated Irregular Network) • viewshed, profile, volume, slope, aspect • not always based on elevation e.g. pollution, climate data, water table, etc…