Download
1 / 38
500 likes | 1.32k Views
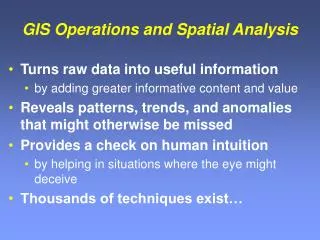
Spatial Data and GIS . Introduction. In many domains we process information in relation to its spatial location E.g., epidemiological studies are dominated by geographical distribution of infected cases Dr Snow’s study of London Cholera epidemic

E N D
Introduction • In many domains we process information in relation to its spatial location • E.g., epidemiological studies are dominated by geographical distribution of infected cases • Dr Snow’s study of London Cholera epidemic • engineering designs have a strong spatial basis • CAD/CAM systems deal with locations of components in a design • Image processing involves segmenting pixel data in relation to their location to identify objects of interest • Position aware devices such as mobile phones allow us to track individual movement Dept. of Computing Science, University of Aberdeen
Geospatial Data • Data those are related to geographic locations are said to be geospatial • Dr Snow’s data are geospatial – data about geographic locations of water pumps and deaths due to cholera • Weather maps are geospatial – weather measurements such as temperature and rainfall over a region • In general, data shown on maps is geospatial • In this course, spatial data = geospatial data • Many of our decisions are based on geospatial data • Weather at a location drives our decision to plan a picnic at that location • Supermarkets decide the size and type of a new store after thoroughly analysing the characteristics of the neighbourhood • Spatial data mining helps to • Extract useful information for decision making Dept. of Computing Science, University of Aberdeen
Example Data <4.79 <3.51 <2.23 % Unemployment rates For Aberdeen Wards Based on UK Census 2001 Dept. of Computing Science, University of Aberdeen
GIS • GIS refers to • Geographic Information System • Or Geospatial Information System • GIS offers • generic (application independent) functionality required for supporting decision making with geospatial data • Data storage and retrieval • Data analysis • Visualization • GIS combines • Data analysis and Visualization for helping users understand geospatial data • The focus is on offering generic functionality to help users understand data rather than make decisions for them like expert systems Dept. of Computing Science, University of Aberdeen
GIS Modules Main Modules of a GIS Spatial Visualization (Maps) Spatial Data Analysis Spatial Database Dept. of Computing Science, University of Aberdeen
Characteristics of Spatial Data (1) Spatial attribute Non-Spatial attribute Non-Spatial attribute • Spatial Data has two kinds of attributes • Spatial attributes –location information • E.g. longitude and latitude for points and boundary information for areas • Non-spatial attributes • E.g. name, unemployment rates • We are mainly interested in the non-spatial attributes, e.g. unemployment rates • But want to study them taking their location (spatial attributes) into consideration • Location attribute is different from Name and Unemployment rates • Next, we learn why this is so. Table: % Unemployment Rates for Aberdeen Wards based on UK Census 2001 Dept. of Computing Science, University of Aberdeen
Characteristics of Spatial Data (2) • The Location attribute in the table has values • boundary1, boundary2, etc • Each boundary value (e.g. boundary1) holds data required to draw a ward (e.g. Pitmedden) in the census map shown earlier • This means, values of spatial attributes are geometrical (graphical) data • This is the fundamental difference between spatial attributes and non-spatial attributes • Spatial attributes store geometrical information • Many of the special characteristics of spatial data can be derived from this. Dept. of Computing Science, University of Aberdeen
Characteristics of Spatial Data (3) • Objects with similar attributes usually are located nearby spatially • Everything is related to everything else but nearby things are more related than distant things – first law of Geography • In spatial statistics this property is called spatial auto-correlation • Recall auto-correlation from time series data • Data values are not independent • Most geographic locations are unique (spatial heterogeneity) • Therefore global parameters do not always accurately describe local values Dept. of Computing Science, University of Aberdeen
Characteristics of Spatial Data (4) • Relationships among non-spatial attributes are explicit • Foreign keys make explicit links between tables • But relationships among spatial attributes are implicit • boundary1 and boundary2 could be neighbours, but this is not explicitly represented • Summary of special properties of spatial data • Auto-correlation • Spatial heterogeneity • Implicit spatial relationships • Modelling spatial data needs to be different from modelling ordinary data • Data modelling influences data manipulation • Querying • Analysis • Visualization Dept. of Computing Science, University of Aberdeen
Concept of Modelling • Common sense view • Representation of ‘something’ at a level of detail suitable for its purpose • For example, an architects ‘model’ of a bridge • Architects model brings the bridge to life even before its construction • Formal View • Modelling function translates some source domain into its corresponding target domain • Target domain is used (because it is simple in some sense than the source domain) for analysis • An inverse modelling function should be available for translating results of analysis from target domain to the source domain Dept. of Computing Science, University of Aberdeen
Modelling GeographicSpace • Not possible to directly perceive geographic space in its entirety • Representations (or models) are the only sources of information about geographic space • Representations of smaller geographic areas merged to create global representations • Maps have been the primary models of geographic space • From cave drawings to Google Maps • The field of map making is called ‘Cartography’ Dept. of Computing Science, University of Aberdeen
Geometries Model Geographic Space • Several different geometries exist • Each is a study of spatial properties that are invariant under certain groups of transformations • E.g. In Euclidean geometry distance and angle are preserved under translation, reflection and rotation • Topology is another geometry that for example preserves openness/closedness of a curve under stretching • Geometries are hierarchically related • As you move up the hierarchy, each successive geometry preserves more properties than its subclass • Different kinds of Geographic phenomena are represented by different geometries Dept. of Computing Science, University of Aberdeen
Computational Models of Geographical Space • Two fundamentally distinct views • Absolute space • Space exists in itself and objects are located in this absolute space • You first create space and put objects in that space • Relative space • Space is one of the attributes of objects related to other objects • You first define objects and they create space as a result of their relative locations and interactions • Both these views are used in modelling spatial information computationally Dept. of Computing Science, University of Aberdeen
Relational Data Model • Relational databases model data into a connected set of relations • Each relation is a collection of tuples • Tuple1 -> (location1,temperature1,rainfall1) • Tuple2 -> (location2,temperature2,rainfall2) • For certain applications, relational models are often criticised for impedance mismatch between • the relational database storing the data • the object oriented code manipulating that data • For spatial data this mismatch is a problem • The inherent structure of spatial data is not captured by the relational model Dept. of Computing Science, University of Aberdeen
Relational Model Example Country Boundary Point Contour Dept. of Computing Science, University of Aberdeen
Query - Example • Return the contours of France • An SQL Query: Select Boundary.id-controur,x,y From Country,Boundary,Contour,Point Where name = ‘France And Country.id-boundary=Boundary.id-boundary And Boundary.id-contour=Contour.id-contour And Contour.id-point=Point.id-point Order by Boundary.id-contour,point-num; • Several problems as seen next Dept. of Computing Science, University of Aberdeen
Problems with using RDBMS for Spatial Data • Formulating queries requires knowledge of the spatial object’s structure • New queries with change in structure • Bad performance • More space used and more cost in computing joins • User unfriendly • Manipulating points is not easy • Difficulty n defining new spatial types • Impossible to express geometric computations • Adjacency test, point query or window query Dept. of Computing Science, University of Aberdeen
Field-Based Models • Computational Model of absolute space • Information space is viewed as a collection of fields • Temperature field, rain fall field and wind speed field form a weather information space • Data attribute values are computed by functions of locations • Temperature1 = Temperaturefield(location1) • Tempearture2 = Temperaturefield(location2) • RainFall1 = RainFallfield(location1) • The field is the function, not the set of values • Field is the first-class entity in this kind of modelling Dept. of Computing Science, University of Aberdeen
Field-Based Models (2) • Field-based model is a function on location • So we need location data as independent variable • Given a region of space (geography) we need a framework to partition that space into locations • Tessellation of space • For example using grids • A field based model then a function that maps each location to its attribute value • Useful for modelling data from continuous spatial processes • Temperature fields, elevation data Dept. of Computing Science, University of Aberdeen
Object-based Models • Computational Model of Relative Space • One or more tuples from the relational model can be lumped together as data values corresponding to an object • All the tuples that have temperatures below zero, rainfall above 10mm describe an object • The object then has spatial reference • The above weather conditions could be true for a region of geography • Object is the first-class entity in this kind of modelling • Useful for modelling data from discrete spatial processes • Administrative units, rivers Dept. of Computing Science, University of Aberdeen
Object-based Models(2) • Object-based model maps directly to the object-oriented model we are familiar in computing science • Objects have attributes some of which happen to be spatial and therefore have values related to space (or geography) • Field-based models also can be mapped to object-oriented models but not directly • Field-based and object-based models are complementary not competing • Both are useful for different contexts Dept. of Computing Science, University of Aberdeen
OGC Reference Model • OGC is Open Geospatial Consortium • Organization for development of standards for geospatial and location based services • Reference Model is defined in terms of features and themes • Geographic Object (Feature) • An abstraction of a real world phenomenon • E.g a river, a city and a country • Feature has two components • Descriptive attributes (non-spatial attributes) • E.g name and population of a city • Spatial attributes • Geometry • Theme (Feature Collection) • Similar to a relation (table) in the relational model • E.g. Rivers, cities and countries Dept. of Computing Science, University of Aberdeen
Coordinate Reference Systems • Spatial attributes (geometry) of a feature refer to locations on Earth • A coordinate reference system is used to define unique values to every location on Earth • For example, Geographic Coordinate System uses longitude and latitude to define uniquely locations on Earth • Geocentric and projected coordinate reference systems are other examples • Datum defines origin, orientation and scale of a coordinate system and links it to Earth • This is required to use the abstract system for positions of feature practically • Coordinate reference system (which includes Datum) is part of the OGC reference model • Without a geo-reference system geometries of features cannot be defined Dept. of Computing Science, University of Aberdeen
Spatial Databases • Connected set of Themes (corresponding to relations/tables in relational model) • Each of these is a collection of geographic objects (features) • Geographic objects correspond to tuples or rows in relational model with • non-spatial attributes and • spatial attributes • Geometric attributes such as location and shape • Support for geospatial data in MySQl (version 4.1 onwards) • Two example themes: • Countries (name, population, geo:region) • Languages (language,geo:region) Dept. of Computing Science, University of Aberdeen
Countries Dept. of Computing Science, University of Aberdeen
Languages Dept. of Computing Science, University of Aberdeen
Queries on Spatial databases • Familiar operations from relational algebra can be defined on themes • Theme projection • Πpopulation,geo(Countries) • Theme selection –similar to relational selection • σ population>50(Countries) • Theme union – similar to relational union • You can work these out yourself Dept. of Computing Science, University of Aberdeen
Spatial Join • In a relational database, join queries help users to connect or link or join tables • Spatial databases allow users to join themes • These are called theme overlays • An object of one theme is joined with an object of the other theme if their geometries intersect • In our example, the resulting theme will show all the rows and columns of both the tables • You can work it out yourself Dept. of Computing Science, University of Aberdeen
Special Queries • Some queries to spatial databases are more complicated than the relational queries • Window query – select the objects that overlap a given window or area • Point query – select the objects that contain the given point • Clipping – select the objects with the exact intersection of the geometry of the object and the given window • To process such queries GIS possesses geometric and topological sense • We will not go into the details here Dept. of Computing Science, University of Aberdeen
Visualization of Spatial Data • Results of theme operations are not very useful if shown as tables • They are normally shown as maps in GIS • Theme overlay is the main operation for creating maps in GIS • Data belonging to the required themes is retrieved from the database and plotted as overlays in a GIS (you will learn to use overlays in the practical) • As discussed with other visualizations geo-visualization (or map drawing) too has two aspects • Designing the map • Rendering the map Dept. of Computing Science, University of Aberdeen
Visualization of Spatial Data (2) • Maps can be rendered using • Vector graphics • Raster graphics • This distinction can be traced back to the distinction between • Object-based data models (Vector models) • Field-based data models (Raster models) • Many modern GIS systems allow mixing and matching these two modes to render maps • Google maps overlay vector based spatial information on top of raster satellite image Dept. of Computing Science, University of Aberdeen
Map Projections • Earth’s surface is a spheroid • A globe is the only realistic visualization of Earth’s surface • Maps project Earth’s surface on to a plane • The surface of a spheroid cannot be projected on to a plane without distortion • All large area maps distort some aspect of Earth’s surface • Either shape or size of features • Several different projections are defined, each retains certain aspects of Earth’s surface • Each projection uses a different coordinate reference system • Purpose of a map guides the selection of an appropriate projection Dept. of Computing Science, University of Aberdeen
Spatial Data Types • Features can be three Types • referenced to a point • E.g. Location information of a restaurant • referenced to a path • E.g. Path information from my home to University • referenced to an area • E.g. information about a region bounded by a polygon • We can transform point data into area data by aggregating values over all the points in an area • Different data analysis tasks and techniques are employed for each of these data types Dept. of Computing Science, University of Aberdeen
Points Data • Event prediction • E.g. given the spatial distribution of crimes in an area, predict the likely location of a future crime • Given some actual observations predict unknown values at intermediate locations by interpolation • Spatial regression Dept. of Computing Science, University of Aberdeen
Paths Data • Finding least ‘cost’ path over a route map. • Navigation systems on modern cars find paths and communicate the path information graphically and by speech • A navigation system is a good example of the kind of systems we are interested in this course • They analyse spatial data to extract important information plus • They also communicate the extracted information in different forms to suit the user Dept. of Computing Science, University of Aberdeen
Area/Lattice data • Public domain is flooded with this type of data • E.g. census data is available for public as aggregated values over a census tract • Scrol – Scotland’s Census Results Online • Weather parameters such as temperature and rainfall are reported as aggregated values over a region such as Grampian and Lothian • Disease count data where counts of a disease are recorded for regions or counties • Technology to analyse and communicate this type of data has large impact on public life Dept. of Computing Science, University of Aberdeen
Summary • Building the informational and computational infrastructure to support storing, retrieving, analysing and visualising geospatial data is the job of computer scientists • Advancement of Geographic Information Systems (GIS) and Global Positioning System (GPS) have allowed us to study most data in relation to its spatial location • We are now in a position to formulate well formed spatial queries or hypotheses • Technology is available to answer such queries or test those hypotheses • All of us will use more and more spatial data in the future Dept. of Computing Science, University of Aberdeen