Download
1 / 1
10 likes | 149 Views
Methods PCA-like approach in Matlab (NIPALS) Savitzky-Golay Smoothing Replaces random missing values Evenly spaces domain No mean-centering or scaling Missing values replaced by estimates Iteratively re-weighted least squares Estimate loadings ( p= ( t’t ) -1 t’X )

E N D
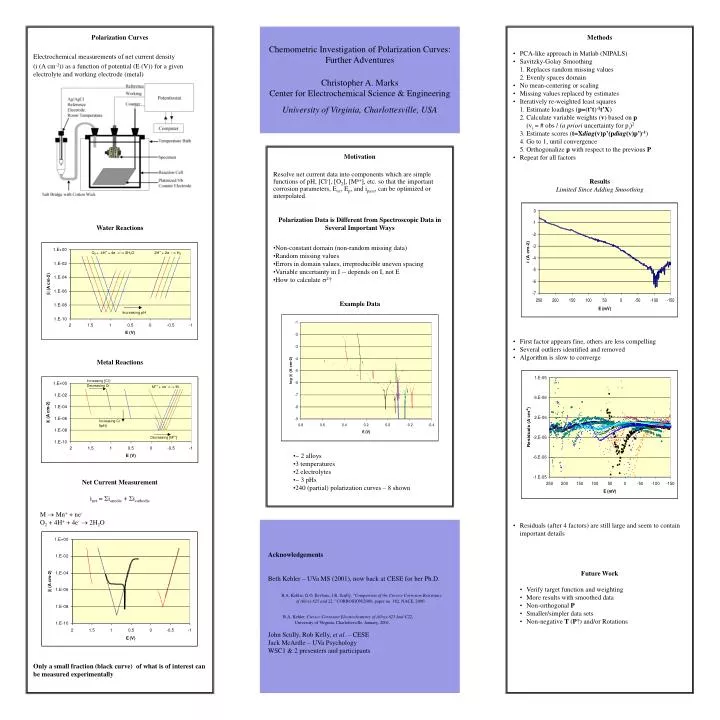
Methods • PCA-like approach in Matlab (NIPALS) • Savitzky-Golay Smoothing • Replaces random missing values • Evenly spaces domain • No mean-centering or scaling • Missing values replaced by estimates • Iteratively re-weighted least squares • Estimate loadings (p=(t’t)-1t’X) • Calculate variable weights (v) based on p(vi = # obs / (a priori uncertainty for pi)2 • Estimate scores (t=Xdiag(v)p’(pdiag(v)p’)-1) • Go to 1, until convergence • Orthogonalize p with respect to the previous P • Repeat for all factors • Results • Limited Since Adding Smoothing • First factor appears fine, others are less compelling • Several outliers identified and removed • Algorithm is slow to converge • Residuals (after 4 factors) are still large and seem to contain important details • Future Work • Verify target function and weighting • More results with smoothed data • Non-orthogonal P • Smaller/simpler data sets • Non-negative T (P?) and/or Rotations Polarization Curves Electrochemical measurements of net current density (i (A cm-2)) as a function of potential (E (V)) for a given electrolyte and working electrode (metal) Water Reactions Metal Reactions • Net Current Measurement • inet = ianodic + icathodic • M Mn+ + ne- • O2 + 4H+ + 4e- 2H2O • Only a small fraction (black curve) of what is of interest can be measured experimentally Chemometric Investigation of Polarization Curves: Further AdventuresChristopher A. MarksCenter for Electrochemical Science & EngineeringUniversity of Virginia, Charlottesville, USA Motivation Resolve net current data into components which are simple functions of pH, [Cl-], [O2], [Mn+], etc. so that the important corrosion parameters, Eoc, Ep, and ipass, can be optimized or interpolated. • Polarization Data is Different from Spectroscopic Data in Several Important Ways • Non-constant domain (non-random missing data) • Random missing values • Errors in domain values, irreproducible uneven spacing • Variable uncertainty in I -- depends on I, not E • How to calculate 2? • Example Data • ~ 2 alloys • 3 temperatures • 2 electrolytes • ~ 3 pHs • 240 (partial) polarization curves – 8 shown AcknowledgementsBeth Kehler – UVa MS (2001), now back at CESE for her Ph.D.B.A. Kehler, G.O. Ilevbare, J.R. Scully, "Comparison of the Crevice Corrosion Resistance of Alloys 625 and 22," CORROSION/2000, paper no. 182, NACE, 2000.B.A. Kehler, Crevice Corrosion Electrochemistry of Alloys 625 And C22, University of Virginia, Charlottesville, January, 2001.John Scully, Rob Kelly, et al. – CESE Jack McArdle – UVa PsychologyWSC1 & 2 presenters and participants