Download
1 / 66
670 likes | 880 Views
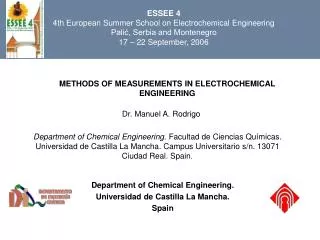
ESSEE 4 4th European Summer School on Electrochemical Engineering Palić, Serbia and Montenegro 17 – 22 September, 2006. METHODS OF MEASUREMENTS IN ELECTROCHEMICAL ENGINEERING. Dr. Manuel A. Rodrigo.

E N D
ESSEE 44th European Summer School on Electrochemical EngineeringPalić, Serbia and Montenegro17 – 22 September, 2006 METHODS OF MEASUREMENTS IN ELECTROCHEMICAL ENGINEERING Dr. Manuel A. Rodrigo Department of Chemical Engineering. Facultad de Ciencias Químicas. Universidad de Castilla La Mancha. CampusUniversitario s/n. 13071 Ciudad Real. Spain. Department of Chemical Engineering. Universidad de Castilla La Mancha. Spain
CONTENTS • CURRENT DISTRIBUTION • 1.1 Importance of current distribution visualization • 1.2 Measurement of current distribution • 1.2.1 TYPES OF MEASURING METHODS • 1.2.2 PARTIAL-CELL APPROACH • 1.2.3 SUBCELLS APPROACH • 1.2.4 SEGMENTED ELECTRODES • 1.2.5 RESISTORS NETWORK • 1.2.6 PRINTED CIRCUIT BOARD APPROACH • 1.2.7 TYPES OF MEASUREMENTS OF THE LOCAL CURRENT IN PASSIVE RESISTOR NETWORK • 1.2.8 MATHEMATICAL MODELLING • 1.2.9 MAGNETOTOMOGRAPHY • 1.3. Some new applications: calculation of mass diffusion overpotential distribution in a PEMFC • MEASUREMENT OF MASS TRANSFER COEFFICIENTS BY ELECTROCHEMICAL TECHNIQUES • 2.1 Why? • 2.2 How? • 2.3 Typical setup for measuring average cell mass transfer coefficients • 2.4 Experimental procedure • 2.5 Calculation of the mass transfer coefficient • 3. LOCAL MASS TRANSFER DISTRIBUTION • 3.1 Importance of local mass-transfer distribution visualization • 3.2 Limit current mapping • 3.3 Measurement of mass transfer by electrochemiluminiscence • 3.4 Mathematical modelling • WALL SHEAR STRESS • 4.1Importance of wall-shear stress distribution visualization • 4.2 Measurements of wall-shear stress • 4.3 Measurement of local shear in three-phase fluidized beds • 4.4 Wall shear stress in multiphase flow
1. CURRENT DISTRIBUTION 1.1 Importance of current distribution visualization It is one of the more important parameters in the performance of an electrochemical cell, but unfortunately in the electrochemical industry and in the electrochemical literature, current distribution has not received the attention that it deserves I I Through the wire flows the same current, but the current distribution on the electrode surface is different Uniform current distribution Non-uniform current distribution
Some examples of the importance of uniform current distribution Electroplating: non-uniform current distribution can cause a local variation of the thickness of the deposited metal
Electrolyses cell non uniform corrosion of electrodes Small contact-surface current feeder Aluminium surface after an electro-dissolution process Poor efficiency, changes in the products conversion ratio 1/3i 2/3 i i Current efficiency 83.3% Current efficiency 100% Part of these electrons are consumed by an electrochemical side reaction because the desired reactant does not arrive to the anode surface at the required rate (if reagents arrives to the electrode at the same rate that they are consumed)
PEM fuel cell Uniform current distribution Produce maximum power densities Ensure maximum lifetime for the cell components • Causes of non-uniform current distribution in FC during fuel cell operation: • inhomogeneities in the reactant concentration, • contact pressure, • temperature distribution, • water management along the flow field • etc.
Examples of local current distribution in a circular-shape electrode uniform Current scale high low
Factors affecting current distribution: • Geometry of the cell system. Current feeders or collectors • Conductivity of the electrolytes and the electrodes. • Activation overpotentials at the electrodes which depend on the electrode kinetic. • Concentration overpotentials which are mainly controlled by the mass transport processes. • Other factors
1.2 Measurement of current distribution Load or power supply electrolyte electrodes Purpose of the measurement b) Current distribution in one electrode a) Current distribution in the cell cathode anode
1.2.1 TYPES OF MEASURING METHODS • Partial approaches • Subcells • Segmented electrodes • Passive resistor network Invasive methods yes Is the cell modified for the measurement? (is current distribution measurement associated with constructional modifications of the cell? ) no • Mathematical modelling • Magnetic measurements Non-invasive methods
1.2.2. PARTIAL-CELL APPROACH. Portions or segments of the cell are tested independently by inactivating other portions. electrode electrolyte electrode The inactivation can be carried out either by masking or by other procedure (e.g. in FC some parts of the MEA can be prepared without catalyst
subcell 1 inactive subcell 3 inactive the specific performance is determined by difference. Subcell 1 Subcell 2 Subcell 3 whole cell CELL VOLTAGE Subcell 1 inactive To increase the accuracy more partial cells should be studied Subcell 3 inactive INTENSITY Advantages: very simple, easy to manufacture Disadvantages: it can only be used as a first approach
1.2.3. SUBCELLS APROACH Several electrically isolated subcells are placed are conveniently placed at different locations in the cell a section of the anode is punched out a section of the cathode is punched out
The step is repeated in several determined locations inside the cell The former anodes and cathodes are replaced with smaller ones. Main cell subcells The resulting empty space is filled with a isolating gap
Main cell Subcell m Subcell 1 Subcell n Lm Lmain cell Ln L1 The subcells are separately controlled. To measure current distribution every subcell voltage has to be adjusted to fit approximately the mail cell voltage SUBCELL 5 CELL VOLTAGE MAIN CELL SUBCELL 3 INTENSITY Advantages Gives more information on a much smaller scale about the localised current density than the partial approach Disadvantages Complex manufacture. Great care has to be taken to ensure proper alignment during assembly of the cell
1.2.4. SEGMENTED ELECTRODES Measurement circuits Segmented electrode or segmented BPP (in a FC) isolation electrolyte Counter electrode • Coverage of the whole electrode area • Good spatial resolution This approach allows a very accurate current distribution mapping
Example of measuring device for each piece of electrode ohmic resistor Volt-meter Piece of electrode To assume a high ratio between through-plane and in-plane conductivity segmented electrodes must be manufactured in a thin shape. This generates problems related to mechanical strength Very invasive method. It can affect significantly to the current distribution. Big differences can exist between the measure and the actual current distribution
1.2.5 RESISTORS NETWORK Buss plate Passive resistor network electrode Main problem - appearing of lateral currents Main advantage: It does not require any modification of the electrodes (or of the BPP or MEA in FC) It is less invasive Coverage of the whole electrode area Good spatial resolution Volt-meter current Drawbacks Electrical properties of the resistors depends on temperature
Completely isolated resistors Buss plate Isolated wires Resistor matrix electrode Advantages Improved mechanical strength To assume a high ratio between through-plane and in-plane conductivity resistor matrix must be manufacture in a thin shape. This generates problems related to mechanical strength
interconnected resistors Buss plate Isolated wires Resistor matrix electrode Advantages Less affected by in-plane current distribution
1.2.6 PRINTED CIRCUIT BOARDS APPROACH Current collector current backside Through-holes frontside Easy to manufacture Easy to add electrical components Possibility of multilayer manufacture Can be used as BPP in FC
1.2.7 TYPES OF MEASUREMENTS OF THE LOCAL CURRENT IN PASSIVE RESISTOR NETWORK Ohmic resistors passively Hall-effect sensors (only measure) Current transformers actively Multichannel potentiostats (Measure and manipulation)
Ohmic resistors Volt-meter current • Very simple • Frequently used • Very invasive. It can affect the cell current distribution
Hall-effect sensors When a current-carrying conductor is placed into a magnetic field, a voltage will be generated perpendicular to both the current and the field. This principle is known as the Hall effect. The figure shows a thin sheet of semiconducting material (Hall element) through which a current is passed. The output connections are perpendicular to the direction of current. When no magnetic field is present, current distribution is uniform and no potential difference is seen across the output. When a perpendicular magnetic field is present, a Lorentz force is exerted on the current. This force disturbs the current distribution, resulting in a potential difference (voltage) across the output. This voltage is the Hall voltage (VH). Its value is directly related to the magnetic field (B) and the current (I). Hall effect sensors can be applied in many types of sensing devices. If the quantity (parameter) to be sensed incorporates or can incorporate a magnetic field, a Hall sensor will perform the task
Current follower circuit Standard operational amplifier circuit for current-to-voltage conversion To working electrode - + To data acquisition card - + For very low currents
1.2.8 MATHEMATICAL MODELLING Current distribution model New proposal e.g. Modelled results simulation no Experimental conditions Agreement? experiments yes experimental results e.g. product conversion
1.2.9 MAGNETOTOMOGRAPHY Patented technology Non invasive method xcellvision - Instrumentation for Fuel Cells and Fuel Cell System Simulation
z x Sensor 1 y Sensor 2 Sensors are used for magnetic field data acquisition as a function of the position. The experimental setup allows the sensor to measure the magnetic field strength (H) at different positions around the cell
Ij Hi high low Map of the current intensity high low
2. MEASUREMENT OF MASS TRANSFER COEFFICIENTS BY ELECTROCHEMICAL TECHNIQUES 2.1 Why? Bulk solution Electrode surface high current Concentration of the electroactive species low influence the current distribution Affect to the product distribution Affect to the efficiency
2.2 How? e e - - Ssurface Sbulk Electrode R
The method is based on a diffusion-controlled reaction at the electrode surface: Typical concentration 5 mM of ferrocyanide and 20mM of ferricyanide to make sure a cathodic controlled electrochemical process If the cathode is used as a probe The area of the anode should be larger than that of cathode for a cathodic controlled-process A large quantity of inert electrolyte (NaOH, Na2SO4, KSO4, …) has to be added as supporting electrolyte to minimize the migration effects (to make them negligible compared to diffusion and convection)
2.3 Typical setup for measuring average cell mass transfer coefficients The electric measurement devices are used to obtain high accuracy of voltage and current values, than those provided by the power supply. The electrical energy is applied with the power supply connected to the electrodes The reservoir contains the electrolyte Oxygen and hydrogen generated in the electrochemical cell can be stripped with nitrogen. V A The heterogeneous processes take place in the electrochemical cell, where mass transfer processes are studied. The flow rate is measured by the rotameter. The heat exchanger keeps the electrolyte temperature at the desired set point. The pump propels the electrolyte through the electrochemical cell.
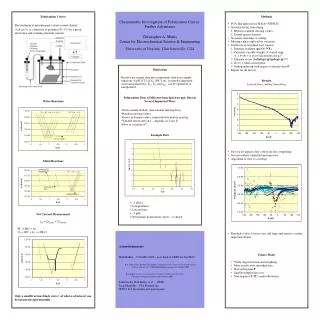
2.4 Experimental procedure I Cb Current measured 0 Concentration 0 Distance from the electrode Applied potential V 0 a) No potential is applied to cell. No current
I Cb Current measured 0 Concentration 0 Distance from the electrode Applied potential V 0 a) Small potential is applied to cell. No current
I Cb Current measured 0 Concentration 0 Distance from the electrode Applied potential V 0 b) Potential scan begins
I Cb Current measured 0 Concentration 0 Distance from the electrode Applied potential V 0
I limit I Cb Current measured 0 Concentration 0 Distance from the electrode Applied potential V 0 c) Current limit is reached
I limit I Cb Current measured 0 Concentration 0 Distance from the electrode Applied potential V 0 d) Plateau zone
I limit I Cb Current measured 0 Concentration 0 Distance from the electrode Applied potential V 0
I limit I Cb Current measured 0 Concentration 0 Distance from the electrode Applied potential V 0 e) Other electrochemical processes (e.g. Electrolyte decomposition)
I limit I Cb Current measured 0 Concentration 0 Distance from the electrode Applied potential V 0
2.5 Calculation of the mass transfer coefficient e e - - Ssurface=0 Sbulk Electrode R
3. LOCAL MASS-TRANSFER DISTRIBUTION 3.1 Importance of mass-transfer distribution visualization Mass transfer greatly influence current distribution Mass transfer can be easily improved in a cell by using turbulence promoters Why? Local mass transfer distribution can depend on a lot of factors: Design of the inlet Design of the outlet Flow characteristics Turbulence promoters Smooth or uneven surfaces … How? By measuring the limit current at different positions on the electrode By using other techniques
cathode anode Power supply V voltmeter Push-button switch A ammeter A A 3.2 Limit current mapping
Arrays of microelectrodes Drawback many measuring sites
Corner plate centre
Current of microelectrodes resistor Total current Measuring device Current of the main electrode
3.3 Measurement of mass transfer by electrochemiluminescence + N2 + light H2O2 Direct electrolyses Direct electrolyses Very slow rate Iridium tin dioxide electrode H2O2
3.4 Mathematical modelling Mass transfer distribution model New proposal e.g. Modelled results simulation no Experimental conditions Agreement? experiments yes experimental results e.g. product conversion