Download
1 / 47
821 likes | 1.58k Views
Electrochemical Techniques for Corrosion Measurements. Assignment. Present a critical examination of the proposed mechanisms of CO 2 and H 2 S corrosion with particular emphasis on the cathodic (oxidation) reactions. Due Date 5 June 2009. Corrosion Measurements

E N D
Assignment • Present a critical examination of the proposed mechanisms of CO2 and H2S corrosion with particular emphasis on the cathodic (oxidation) reactions. • Due Date 5 June 2009
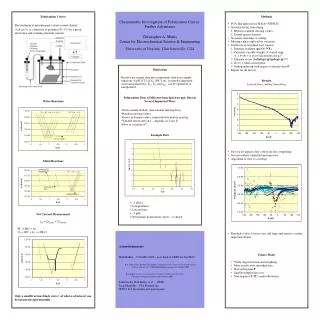
Corrosion Measurements Involve the use of a potentiostat for applying a potential (relative to a reference electrode) and measuring the current (flowing from the working electrode to the counter or auxiliary electrode) *ensure specimen potential (w.r.t. counter) constant … even though solution resistance might alter. 3
The Manual Potentiostat Variable High Voltage Source 50-300 V Ammeter (current) High Impedance Voltmeter 1012 Ω Working Electrode Reference Electrode Auxiliary Electrode
Electrochemical Impedance Spectroscopy • Resistance • Ohms Law • For a resistor, R, it follows Ohm’s Law at all current and voltage levels • The resistance value is independent of frequency • AC current and voltage signals through a resistor are in phase with each other
Electrochemical Impedance Spectroscopy • Impedance • Impedance applies to AC voltage and current • Like resistance impedance is a measure of the ability of a circuit to resist the flow of electrical current • The excitation potential or AC voltage can be expressed as a function of time
Electrochemical Impedance Spectroscopy • The relationship between radial frequency ω (radians s-1) and frequency (f) hertz is: • The response to the AC voltage is given by:
Electrochemical Impedance Spectroscopy • Similar to Ohm’s law • The important point to remember is that when an AC voltage is applied to a pure capacitor the resulting AC current is shifted in phase by 90o • There is no phase shift for a pure resistor
Electrochemical Impedance Spectroscopy Current phase shift due to impedance. Through a capacitor this phase shift is 90o Applied Voltage Resulting Current
Electrochemical Impedance Spectroscopy • Randles circuit for a simple corroding system • Rs = the solution resistance • Rct = the charger transfer (polarisation resistance) • Cdl = the double layer capacitance
Electrochemical Impedance Spectroscopy • Nyquist plot for the Randels circuit ← Increasing Frequency Capacitance Charge transfer resistance = Rtotal - Rs Solution Resistance Resistance
EIS Nyquist Plots • A Nyquist plot is made up of a series of vectors representing the total magnitude of the resistance and capacitance components Non Resistive Component Phase angle
Electrochemical Impedance Spectroscopy • Bode impedance plot Impedance Rct Solution resistance Frequency →
Electrochemical Impedance Spectroscopy • Bode Phase plot Phase angle Frequency →
EIS (Summary) We start here at the high frequency
EIS • Diffusion or Mass Transfer controlled process • Nyquist plot - Warburg Impedance ←Frequency
EIS • Diffusion or Mass Transfer controlled process • Bode Impedance plot Impedance Frequency →
EIS • Diffusion or Mass Transfer controlled process • Bode Phase plot Phase Angle Frequency →
EIS – Mass Transfer Controlled Process (Summary) Nyquist Bode Impedance Bode Phase
EIS Equivalent Circuit for a Mixed Kinetic and Charge Transfer Controlled Process
EIS Bode Plots for the Mixed Controlled Reaction Impedance Phase
EIS Equivalent Circuit for a Filmed Corroding Surface (E.g. Failed Coating)
EIS for a Filmed Corroding Surface (E.g. Failed Coating) Bode Impedance (Magnitude Nyquist Bode Phase Angle
Linear Polarization Method Valid for corrosion under activation control. Involves applying a small perturbation to the potential around Ecorr (i.e., ±∆E ≈ 10 mV). N.B. ∆i for summed curve = ia + |∆ic| (∆ia=x) Slope of summed curve (measure E vs i for system) is difference between slopes of curves for the coupled reactions: Sa - Sc
The curves are ~linear within ~20mV – Sa and Sc are constant. For ∆E around Ecorr, Sa and Sc are related to icorr (the required quantity): assuming the high-field approximation for the individual reactions slope slope or Now: Polarization Resistance .. .. is measured. The Tafel coefficient ba and bc must be known.
Remember: during linear polarization measurements we plot E vs i (not log i) around the corrosion potential: = polarization resistance 26
Linear Polarization • This involves the application of low over-potentials and therefore the currents are relatively very small. This means that the charging current (capacitance current) can make a significant contribution to the noise or background current. • Use slow scan rates and perform a cyclic scan to check whether you are measuring capacitance. • The reverse scan should produce an iE curve that retraces over the forward recorded iE curve. • The iE curve can be curved due to a difference in the anodic and cathodic Tafel slopes.
Linear Polarization • It is important to view the iE curve. If the iE curve is curved, the polarization resistance can be obtained by drawing a line that is tangential to the curve at Ecorr and at zero current. • Some portable instruments use a potential-step method. In this case the current, at, for example, -10 mV and +10 mV is measured and Rp is computed from these measurements. • The advantage of this technique is that the current measurements are made at a constant voltage and therefore the charging current is zero. • The disadvantage is that no iE curve is recorded and therefore an error can be introduced if there is curvature in the iE graph
Linear Polarization • The portable instruments that use the potential-step technique, usually apply a high frequency AC signal before the measurement to determine the solution resistance and subtract this value from the measured polarization resistance.
Tafel Method We can only measure the net current across the specimen electrode – at the corrosion potential there is no net current (only local anode – cathode currents which constitute the corrosion current). We cannot measure corrosion rate directly, though we need icorr. Measure potential and current at some distance on either side of Ecorr – extrapolate E - log i curves (in same quadrant) back to Ecorr … Plot of the total current (iT = io + ic) versus potential showing the extrapolation of the Tafel regions to the corrosion potential, Ecorr, to yield the corrosion current, icorr.
Passivation Under certain conditions of potential and pH, some metals form protective films, i.e., they passivate Pourbaix diagram for the iron/water/dissolved oxygen system showing the effect of potential in moving the system from a corrosive (active) region (point 1) to a passive region (point 2) We can exam the kinetics using a potentiodynamic scan and Evans diagram
The polarization curve for the anodic reaction of a passivating metal drawn for potentials more noble than the equilibrium potential (Ee)a Oxidative dissolution of oxide (e.g., Cr2O3 CrO42-) (Ee)M/MO is the equilibrium potential for oxide/hydroxide formation “Flade” Tafel region (icrit is min. reaction rate required to initiate film growth by precipitation of Mn+) The region attained by the metal in a given environment depends upon the cathodic reaction i.e., where the cathodic curve cuts the above anodic curve. 33
Tafel Extrapolation Technique • Involves measurements at high over-potential in which logi is recorded. • The best method of performing these measurements is by : • 1) Using two identical electrodes and recording the anodic curve on one electrode and the cathodic curve on the other electrode. In each case starting at the open circuit potential Eoc (or Ecorr) • 2) Performing the cathodic curve on one electrode starting the scan from Eoc. Turning off the potentiostat and monitoring Eoc until it returns to its original value. The anodic scan is then recorded again starting at the Eoc.
Tafel Extrapolation Technique • Before commencing a Tafel measurement, it is generally best to allow your metal electrode to reach a steady state potential. This can be observed by performing a potential time measurement in which Ecorr is monitored with time. • Scan Rates are normally in the range of 0.1 mV to 5.0 mV per second. The cathodic plot is scanned to an over-potential of about 400 mV. • Anodic potentials can be scanned much higher depending on what information needs to be obtained.
Cyclic Pitting Scans • The technique is used to evaluate the susceptibility of metals to pitting corrosion in a particular environment. It is applicable to metals such as stainless steels, high nickel alloys and aluminium, which form a passive protective film. • With this technique, the potential is scanned to voltages in the transpassive region. • Exceeding the passive region is indicated by a sudden increase in current. At this stage the voltage scan is reversed, usually when the current reaches a certain current density (0.5 mA cm-2)
Cyclic Pitting Scans • The extent of the hysteresis in the reverse scan is an indication of the susceptibility to pitting corrosion. • Pitting corrosion is considered to stop at the potential where the iE curve from the reverse scan crosses the iE curve of the forward scan. • The sudden increase in current can be due to three processes: • 1) Onset of pitting corrosion • 2) Trans-passive uniform corrosion • 3) The oxygen evolution reaction • In the case of trans-passive corrosion, the slope of the iE curve is not as steep compared to pitting corrosion and oxygen evolution. • In the case of oxygen corrosion, the reverse iE curve normally will retrace over the forward iE curve.
Harmonic Analysis • Butler Volmer Equation • When an electrode is polarized near the corrosion potential by a sinusoidal voltage of frequency ω and amplitude U0, then the current density of the Faradaic process is given by:
Harmonic Analysis • The current densities of the Faradaic process will have a distorted sinusoidal form due to the non-linear nature of the cathodic and anodic partial processes in a polarization curve. • The amplitudes of the harmonic components can be obtained by Fourier series expansion of the exponential terms
Harmonic Analysis The simplified magnitude of the first three harmonic components are given by:
Harmonic Analysis • The technique has been verified by the work of Will Durnie, Curtin University. • He compared corrosion rates from HA with those obtained using linear polarization measurements and Stern Geary equation. • When the Tafel slopes obtained from HA were placed in the Stern Geary equation an excellent correlation was obtained.
Harmonic Analysis Durnie, W. H.,Curtin University
Electrochemical Noise (ECN) • ECN measures the current/voltage response between two (largely) identical electrodes. • The two electrodes are coupled together (short circuited together) through a zero resistance ammeter (ZRA). • The random fluctuations of current is measure by the ZRA. • At the same time the random fluctuations in voltage noise at the coupled electrodes is measured with respect to a reference electrode.
Zero Resistance Ammeter A V Working Electrode 2 Working Electrode 1 Reference Electrode Electrochemical Noise Measurement
Rotating dual cylinder electrode (RDCE) • Standard electrochemical cell with reference, auxiliary and RDCE • The RDCE is useful for performing ECN Measurements • ECN uses identical electrodes. In the example shown the electrode areas are not the same since this RDCE was used to investigate preferential weld corrosion