Download
1 / 32
350 likes | 545 Views
LiDAR Data in Flood Modeling. Advantages of LiDAR in Flood Modeling and Important Parameters for LiDAR Mukesh Vyas (GIS Engineer – Modeling Dept.) February 8th, 2008. Delivering a world of solutions. Need. Project Area Processing Data Results Important Parameters Conclusions.

E N D
LiDAR Data in Flood Modeling Advantages of LiDAR in Flood Modeling and Important Parameters for LiDAR Mukesh Vyas (GIS Engineer – Modeling Dept.) February 8th, 2008 Delivering a world of solutions
Need Project Area Processing Data Results Important Parameters Conclusions Application Software Development
Objective • To validate results of very high resolution data. • To develop new customized tools/algorithms to reduce processing time. • Very high resolution data serves the purpose to identify such features and to accommodate such parameters in model setup. • Features like roads, buildings, dykes, riverbanks, flood walls have great effect on flow dynamics & flood propagation. Need
Need Processing Data Results Important Parameters Conclusions Project Area Application Software Development
AOI & Data • Area encompassed approximately 150 sq. miles. • Ground control survey carried for ground control points. • Bare-earth and non-bare-earth points, were classified using algorithm. • Data falling in “UTM, Zone No. 11, having NAD 1983 datum”, with +/- 5 cm vertical accuracy and 2m cell size. Acknowledgement Project Area
Need Project Area Results Important Parameters Conclusions Processing Data Application Software Development
Level of Information Content in High Resolution Data and its Accuracy General Processing Steps • ArcGIS 9x software was used for the processing of data. The processes include: • Mosaicing of DTM tiles derived from LiDAR data. • Clipping of Area of Interest. • Sink filling of data (one of the heaviest & time taking processes). • Deriving Flow direction. • Deriving Flow accumulation (to derive river network). • Deriving river network. Processing Data
Level of Information Content • Level of information content is such high that even micro level flood modeling can be carried. DTM Generated from LiDAR Data (2m Cell Size) Google Earth View of Same Area Processing Data
Need Project Area Processing Data Important Parameters Conclusions Results Application Software Development
Maximum Flood Zone (MFZ) generated using LiDAR data compared with 500 yr RP FEMA Flood Extents Validation • Maximum flood zone (worst case scenario) was generated and validated using Federal Emergency Management Agency’s (FEMA’s) Flood Insurance Rate Map (FIRM). Results
Need Project Area Processing Data Results Conclusions Important Parameters Application Software Development
LiDAR Process Important Parameters
Need Project Area Processing Data Results Important Parameters Conclusions Application Software Development
Summary • Results show that LiDAR has proved as the most accurate tool for Flood Modeling and risk analysis. • Very high resolution data can be used incorporate different feature parameters (like buildings, dykes, etc.) in model setup. • High density LiDAR point cloud provides sound basis to generate accurate elevation model. • Good amount of investment & Higher end workstations are needed for processing such data. Conclusions
Thank You ! Delivering a world of solutions info@rmsi.com www.rmsi.com References
LiDAR Technology • Direct Geo-referencing is possible by using onboard GPS and Inertial Measurement Unit (IMU). • GPS, gives X, Y, Z and through IMU we get Roll (Omega), Pitch (Phi), Yaw (Kappa) angles. • System, fully integrated with air borne inertial navigation system to provide accurate directly observed exterior orientation parameters for each image frame. • Camera – rigidly with LiDAR unit and bore sighted with same high-precision IMU to capture images on-the-fly. Important Parameters
Flight Planning • Flight planning for LiDAR data acquisition: • Data is collected through Bi & Cross directional flight lines over known area to have preliminary correction for orientation parameters. • Redundancy and Confidence of later adjustment is increased by such kind of adjustments. • Longer data strips should be crossed by more than one crossing strips. • This reduces errors introduced by GPS accuracy variations usually occurring during long strips . • If the block consists of a series of different regular sub-blocks, isolated sub-blocks should be fixed by an additional control point. Important Parameters
Data size • Data will be of huge size and reason for that is: • Each point contains, ground X (Easting), ground Y (Northing), ground Z (Elevation) values. • X ,Y ,Z values of aircraft at the time when point was fired. • GPS time that the pulse was received. • Scan angle at the time of instrument firing. • Roll, Pitch, Yaw (Heading) angles at the time of instrument firing. • Intensity of reflective surface based on amount of pulse returned. • Return number value for the pusle. • GPS time tags. • Classification – Description given to each point based on surface that reflectedthe pulse. • Point Layer -- Point layer further describes the relationship of returns within a single laser a point with a return number of (1) could be further classified as "First and Only" or "First of Many”. • Geoid Height -- Elevation difference between the ellipsoid and geoid heights. Important Parameters
Good Density LiDAR Point Cloud Classified/Filtered LiDAR Building, Flights & Other Points Classified/Filtered LiDAR Point Cloud Flight Points with its Check-In/Out stairs Miniature features are also captured in a good density LiDAR Data as seen in these pictures. Important Parameters
Calibration & Orientation of Data • Normally surface-to-surface matching of the different flight passes. • Classify ground in each flight passes separately to remove the noise that vegetation would bring into the comparison. The most common, basic matching steps are: • Solve misalignment angles between laser scanner and IMU together with scanner mirror scale. • Solve dZ correction for all flight lines. After correction: The strips match well with each other. Before correction: Laser points on a building roof show misalignment between different strips. Important Parameters
Filtration/Classification of Data • Selection of algorithm for classifying earth points and non-earth points is very important. • Few selection criteria are: • Mean terrain angle. • Minimum, Maximum and Average heights from the ground, for features in area of interest. • Dimensions of features in area of interest. Important Parameters
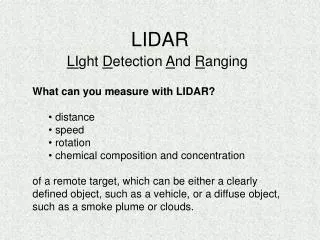
LiDAR • LiDAR – Light Detection And Ranging. • High density, high accuracy, less time in data collection, & processing. • Mostly automatic, whether and light independence. • Minimum ground control required. • Data available in digital format, right from the beginning. • System consist of GPS and IMU. • Topographic system – over land – infrared portion. • Bathymetric system – over water – blue-green portion. Important Parameters
Level of Information Content DTM Generated from LiDAR Data (2m Cell Size) SRTM (90m Cell Size) Processing Data
DTM Generated from LiDAR Data (2m Cell Size) Level of Information Content Processing Data
References • Wang.L and H.Liu. 2006., An efficient method for identifying and filling surface depressions in digital elevation models for hydrologic analysis and modeling, International Journal of Geographical Information Science. Vol.20, No.2, February 2006, 193-213. • Jenson S. K. and J. O. Domingue. 1988. Extracting Topographic Structure from Digital Elevation Data for Geographic Information System Analysis. Photogrammetric Engineering and Remote Sensing 54 (11): 1593-1600. • Garbrecht, J. and L. W. Martz. 1997. The Assignment of Drainage Direction over Flat Surfaces in Raster Digital Elevation Models. Journal of Hydrology, 193:204-213. • A new method for the determination of flow directions. and upslope areas in grid digital elevation models. David G. Tarboton. WATER RESOURCES RESEARCH, VOL. 33, NO. 2, PAGES 309–319, FEBRUARY 1997. Thank You
References Thank You
References (Images) • http://www.nytimes.com/2005/09/21/national/nationalspecial/21walls.html?_r=1&oref=slogin • http://www.richmond.ca/__shared/assets/Dyke_39299.jpg • http://www.pnl.gov/microcats/images/buildings.jpg • http://www.norfolk.gov/Utilities/resources/riprap.jpg • http://www.bbc.co.uk/nottingham/content/images/2007/06/25/flooding_gallery_43_470x353.jpg • http://www.beg.utexas.edu/coastal/poster/graphics/Terrain-mapping-plane.gif • www.terrasolid.fi/en/download/history/tmatch/msse Thank You
Acknowledgement • Thanks to “Bureau of Reclamation, Boise, Idaho, US” for providing High Resolution DEM (2m) generated from High Accuracy LiDAR data through its website. • The project encompassed an area of approximately 150 square miles. LiDAR data was collected with 2.0 to 2.2 meter nominal post spacing, 25 percent field of view and a 30 percent overlap. Ground control survey was conducted and LiDAR data processing included processing of the raw LiDAR data through a minimum block algorithm to classify points as bare-earth or non-bare earth. Acknowledgement