Download
1 / 48
510 likes | 952 Views
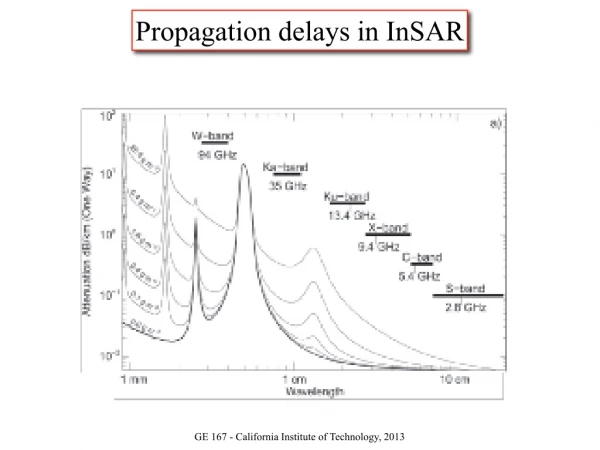
InSAR and LIDAR. Lecture 10. 1. Interferometric Synthetic Aperture Radar (InSAR or IFSAR). Is a process whereby radar images of the same location on the ground are recorded by Two antennas of one platform separated by a few meters (single pass), or

E N D
InSAR and LIDAR Lecture 10
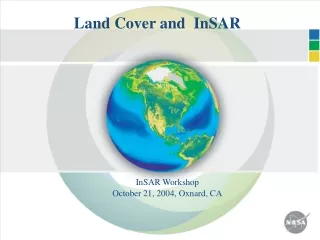
1. Interferometric Synthetic Aperture Radar (InSAR or IFSAR) • Is a process whereby radar images of the same location on the ground are recorded by • Two antennas of one platform separated by a few meters (single pass), or • The same radar system at different times (multi-pass or repeat-pass) • Applications on • Elevation (DEM) derivation (single or multi pass) • Can be as accurate as DEM from traditional optical photogrammetric techniques. However, InSAR operate through clouds, day or night. • The first worldwide DEM (99.97%) was acquired in 2000 by SRTM in 2000, not by the photogrammetry • Surface displacement study (multi-pass only)
Examples • One SAR with 2 antennas (single-pass) • AIRSAR/TOPSAR • Along track interferometric mode (ATI) (L and C) • Ocean current and waves • Cross track interferometric mode (TXI) (L or C) • DEM (3-5 m or 1 m) • Shutter Radar Topographic Mission (SRTM) • C band and X band antennas separated by 60 m • One SAR in different times (multi-pass) • SIR-C • ERS 1,2
Phase of the wave is the total number of cycles of the wave at any given distance (or target) from the transmitter, including the fractional part. One cycle of phase is equal to 360 degrees (or 2π).
The phase difference is called the “interferometric phase” and is determined by effectively subtracting the measured phase at each end of the baseline, and is actually the distance difference from each receiver to the same target.
Calculate altitude (1) (2) (3) (4) (Phase difference) is the fractional phase (value 0-2 radians), λis wavelength
AIRSAR/TOPSAR • Operates from a NASA DC-8 jet. When AIRSAR is used to create topographic map (DEM), it is called TOPSAR. • Fully polarimetric imagery (HH, VV, HV, VH) in three bands: • C (5.6 cm, 5.26 GHz) • L (24 cm, 1.22 GHz) • P (60 cm, 0.45 GHz) • Spatial resolution of 10 m for 20 MHz radar data and 5 m for 40 MHz data. Multilook post-processing can be applied to the radar imagery to reduce speckle at the expense of decreased spatial resolution
Both C (5.6 cm) and X (3 cm) bands in the Main Antenna transmit and receive radar signals, but in the Outboard Antenna only receive signals. http://www2.jpl.nasa.gov/srtm/instr.htm
Glaciers are sensitive indicators of climatic change. They can grow and thicken with increasing snowfall and/or decreased melting. Conversely, they can retreat and thin if snowfall decreases and/or atmospheric temperatures rise and cause increased melting. Landsat imaging has been an excellent tool for mapping the changing geographic extent of glaciers since 1972. The elevation measurements taken by SRTM in February 2000 now provide a near-global baseline against which future non-polar region glacial thinning or thickening can be assessed. http://www2.jpl.nasa.gov/srtm/alaska.htm
Source for SRTM data • USGS gallery: • gahttp://srtm.usgs.gov/srtmimagegallery/index.html • JPL gallery: • http://photojournal.jpl.nasa.gov/mission/SRTM • USGS seamless distribution system (USA 30 m, globe 90 meter) • http://seamless.usgs.gov/
SRTM coverage map To download from here http://seamless.usgs.gov/
Displacement • Interferogram of Landers earthquake 7.3 magnitude on June 18, 1992. This is a remarkable new tech gained recognition thereafter. • This is from ERS-1 • Average displacement along the fault rupture was 3-4 m, maximum was 6m. • Each color cycle represents additional 2.8 cm ground motion or displacement.
Side info: ASTER Global DEM v2 • This is not from INSAR tech, but It has an along-track stereoscopic capability using its near infrared spectral band and its nadir-viewing and backward-viewing telescopes to acquire stereo image data with a base-to-height ratio of 0.6. the improved version 2 was just released on October 17, 2011 • 30 m in pixel size • 30 m accuracy in horizontal and 20 m accuracy in vertical • Free downloaded from • http://demex.cr.usgs.gov/DEMEX/ • http://reverb.echo.nasa.gov/reverb/
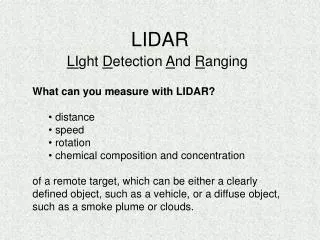
2. LIDAR • LIght Detection And Ranging uses the same principle as RADAR. The lidar instrument transmits laser out to a target. The transmitted light interacts with atmosphere and target. Some of this light is reflected / scattered back to the instrument where it is analyzed. • Use UV, visible, and infrared • Transmitter (laser) and receiver • Distance = C x T /2 • Four types • Ranger finders: it is the simplest lidars, it measures the distance, then create the topographic map • DIAL: Differential Absorption Lidar is used to measure chemical concentrations (such as ozone, water vapor, pollutants) in the atmosphere. • Doppler Lidars: it’s used to measure the velocity of a target • Raman LIDAR: can measure gaseous species
Airborne Lidar System • ALTMS (TerraPoint, USA) • FLI-MAP (John Chance, USA) • ALTM (USA) • TopoEye (USA) • ATLAS (USA)
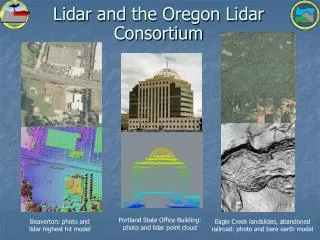
Lidar elevation data of Bristol, UK http://www.npagroup.co.uk/engenv/engineering/lidar_img1.htm
These data are collected with aircraft-mounted lasers capable of recording elevation measurements at a rate of 2,000 to 5,000 pulses per second and have a vertical precision of 15 centimeters (6 inches). After a baseline data set has been created, follow-up flights can be used to detect shoreline changes.
Surface and digital terrain model (DTM) http://www.gisdevelopment.net/technology/rs/ma03234a.htm
digital surface model (DSM) and DTM DTM (bare) DSM
Airborne Lidar http://www.etl.noaa.gov/et2/data/data_pages/texaqs/air_aerosol.html
DIAL laser measures water vapor, clouds, and aerosols by comparing the absorption and scattering of different laser pulses on these atmospheric species http://oea.larc.nasa.gov/PAIS/LASE.html
ICESat • The first LIDAR satellite for Earth launched 1/12/2003 • The Ice, Cloud, and Elevation Satellite (ICESat) • The Geoscience Laser Altimeter System (GLAS) • Two wavelengths: 532 nm and 1064 nm • 532 nm channel: vertical distribution of clouds and aerosols • 1064 nm channel: surface elevation of ice sheets and sea ice thickness, 15 cm in vertical accuracy.
Ice, Cloud, and Land Elevation Satellite (ICESat) Instrument: Geoscience Laser Altimeter System (GLAS) Orbit Height: 600 km Inclination: 94 Laser Wavelengths: 1064 nm and 532 nm Orbit Repeat: 8 day and 91 day Transmitted Pulse FWHM : 5 ns Laser Footprint Diameter on the ground: 70 m Sample interval on the ground: 170 m Sample Rate: 40 laser shots per second. Animation
ICESat used to validate the SRTM- and photogrammtry-derived DEMs Huang et al. 2011
Fig. 5. Elevation profiles along an ICESat ground track over a plateau lake surface. (a) ICESat ground tracks through the Nam Co Lake (centered at 30.42ºN/90.33 ºE) in 2003. (b) The profiles of ICESat and the two DEMs on September 27. (c) The elevation difference between DEM and ICESat (DEM minus ICESat) on September 27.
ICESAT study lake level change Zhang et al., 2011
Lake Qinghai Location of Lake Qinghai, and rivers, hydrological and meteorological station sites
Lake level change Zhang et al., 2011b
Lake level from in-situ station vs. ICESat data Absolute average difference=0.06 m RMSD=0.08 m
ICESat in SIMBA 2007 Xie et al. 2011
CALIPSO • Cloud-Aerosol Lidar and Infrared Pathfinder Satellite Observations (CALIPSO), launched 4/28/2006. • Provide a global set of data on aerosol and cloud properties, radiative fluxes, and atmospheric state. • Equipment: • Lidar: 632 nm and 1064 nm • Radiometer • Camera • http://www-calipso.larc.nasa.gov/
MOLA • Mars Orbiter Laster Altimeter (MOLA), the first satellite-based Lidar system, launched on November 7, 1996 on board the Mars Global Surveyor. • Wavelength 1064 nm, 130 m footprint and 330 m along track spacing (vary with latitude) • To construct a precise topographic map of Mars S N Mars’ south pole has a higher elevation than the north pole by ~6 km.