Download
1 / 18
180 likes | 251 Views
UNIT 3 MEASUREMENT AND DATA PROCESSING. TIER 3. Identify the uncertainties in a particular experiment Construct ways to reduce random errors Apply the rules of significant figures (sig figs) to determine the number of sig figs in a given number

E N D
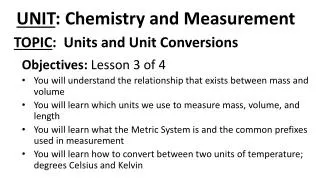
UNIT 3 MEASUREMENT AND DATA PROCESSING TIER 3 Identify the uncertainties in a particular experiment Construct ways to reduce random errors Apply the rules of significant figures (sig figs) to determine the number of sig figs in a given number State the results of calculations to the appropriate number of significant digits
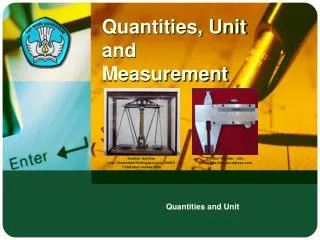
Identify the uncertainties in a particular experiment Each instrument has a degree of uncertainty . For example: A digital instrument has a degree of uncertainty of +/- the smallest scale division An analogue instrument such as a graduated cylinder, thermometer etc has a degree of uncertainty of +/- half the smallest division
DIGITAL BALANCE THIS BALANCE IS CAPABLE OF READING TO THE HUNDREDTH PLACE SO THE MEASUREMENT WOULD BE WRITTEN AS: 12.58 +/- .01 g
ANALOGUE INSTRUMENTS THIS GRADUATED CYLINDER IS MARKED OFF BY EVERY 2 ml . THEREFORE THE UNCERTAINTY WOULD BE +/- 1ml
ANSWER: 38.2 +/- .5 cm3 Each division is 1 cm3 so the uncertainty would be ½ = .5. Always express your data to one estimated digit. Since it is just past the 38 cm3 mark, one person may read it as 38.2 +/- .5 cm3 whereas someone else might read it as 38.3 +/- .5 cm3
Construct ways to reduce random errors Because random errors have an equal probability of being too high or too low, the best way to reduce this errors is to repeat the measurement as many times as possible. The rule of thumb is to do at least 3 trials if not more. If the same person duplicates the experiment with the same results then it is considered repeatable. If several experimenters duplicate the results then it is considered reproducible.
Apply the rules of significant figures (sig figs) to determine the number of sig figs in a given number RULES FOR DETERMINING NUMBER OF SIGNIFICANT DIGITS
SIGNIFICANT FIGURES ADDING AND SUBTRACTING When adding or subtracting, the answer should be quoted to have the same number of digits to the right of the decimal point as there are in the measurement having the fewest digits to the right of the decimal point.
MULTIPLICATION AND DIVISION When multiplying or dividing numbers, the answer should be quoted to have the same number of significant figures that are in the measurement with the fewest number of significant figures
How many significant figures do the following numbers have? 1) 1234 _____ 2) 0.023 _____ 3) 890 _____ 4) 91010 _____ 5) 9010.0 _____ 6) 1090.0010 _____ 7) 0.00120 _____ 8) 0.00030 _____ 9) 1020010 _____ 10) 780. _____ 11) 1000 _____ 12) 918.010 _____ 13) 0.0001 _____ 14) 0.00390 _____ 15) 8120 _____ 16) 72 _____
Solutions to the Significant Figures Practice Worksheet 1) 4 2) 2 3) 2 4) 4 5) 5 6) 8 7) 3 8) 2 9) 6 10) 3 11) 1 12) 6 13) 1 14) 3 15) 3 16) 2