Download
1 / 16
180 likes | 370 Views
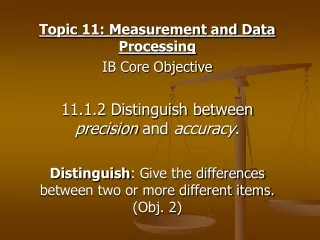
Topic 11. Measurement and data processing SL. SL. Uncertainty and error in measurement. All measurements have always some degree of uncertainty . E.g. How to read a pipettes volume:. The right way to read a pipette a . But is it not possible to hit the line exact every time

E N D
Uncertainty and error in measurement • All measurements have always some degree of uncertainty.
E.g. How to read a pipettes volume: • The right way to read a pipette a. But is it not possible to hit the line exact every time => Random uncertainty. Some time little too much and sometime little to little. • By repeating experiments/measurements you can reduce the random uncertainties.
If the volume is important in an experiment then you should use the right kind of equipment to reduce the random uncertainty. E.g. a measuring cylinder is more accurate than a beaker. • Why?
If you use method b. The wrong way => Systematic error. The volume will always be to low, can’t be reduced by repeating measurements • It is always important to calibrate equipment to reduce the systematic errors.
Precision and Accuracy a. Neither accurate nor precise (large random uncertainty) b. Precise but not accurate. (Small random uncertainty, large systematic error) c. Both precise and accurate (Small random and systematic error)
Random uncertainty as an uncertainty range (±) • The scale on burettes is normally divided in 0.1 ml lines. • That gives you an uncertainty of 0.05 ml. • So when you have measured a volume, the true volume can be 0.05 ml more or less. • E.g. 15.6 ± 0.05 ml
Significant figures. • The number of significant figures in any answer should reflect the number of significant figures in given data.
Uncertainties in calculated results • 15.6 ± 0.05 ml. The absolute uncertainty =0.05 ml • 0.05/15.6 = 0.003 => Percentage uncertainty =0.3%
Determine the uncertainties in resultsOnly a simple treatment is required Addition and subtraction: absolute uncertainties can be added V1=15.6 ± 0.05 ml V2=13.2 ± 0.05 ml The absolute uncertainties = 0.05 ml Vtot= V1 + V2 = 15.6 ± 0.05 + 13.2 ± 0.05 ml= 28.8 ± 0.10 ml
Determine the uncertainties in results.Only a simple treatment is required Multiplication, division and powers: percentages uncertainties can be added V=15.6 ± 0.05 dm3 0.05/15.6 = 0.003 => Percentage uncertainty =0.3% c = 2.00 ± 0.005 mol/dm3 0.005/ 2.00= 0.0025 => Percentage uncertainty =0.25 % n=c*V= 2.00 *15.6 = 31.2 mol Percent uncertainty 0.3 + 0.25 = 0.55 % Absolute uncertainty 0.0055*31.2=0.17 Answer n= 31.2± 0.17 mol
Graphical techniques • Axis should be labelled with quantity divided by units. E.g. mass / g • On the x-axis you shall have the independent variable. The variable that you can decide over/can control . • In the experiment you will collect values at different independent values. This collected values are called dependent values.
You shall set the scale on the axis so you use most of the paper:
The equation of a straight line: y = mx + c • Determining the slope/gradient: Gradient = (y2 –y1)/(x2-x1) =Dy/Dx