Download

1 / 19
190 likes | 337 Views
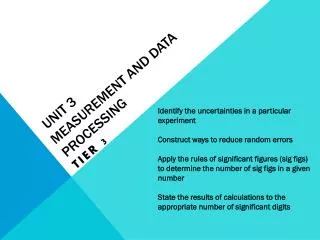
Unit 2: Measurement & Data. 8 th Grade Mrs. Morgan. Review: Once Again. Data - the facts, figures, and other evidence scientists gather when they conduct an investigation . Independent variable - (x axis) the variable that is deliberately manipulated (changed on purpose )

E N D
Unit 2: Measurement & Data 8th Grade Mrs. Morgan
Review: Once Again Data-the facts, figures, and other evidence scientists gather when they conduct an investigation. Independent variable- (x axis) the variable that is deliberately manipulated (changed on purpose) Dependent variable-(y axis) changes value as others change.
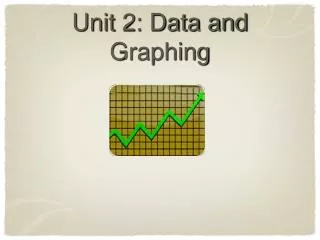
3 Types of Graphs • line graph shows relationship where the dependent variable changes b/c of the independent variable • Scatter plot http://4.bp.blogspot.com/_46URaoUSp0A/S9B6OMq9qfI/AAAAAAAAAGE/IcQA37CwMT4/s1600/scatterplot.gif
2. Bar graph compare information collected by counting. 3. Circle or Pie graph show how a whole is broken into parts.
Reading Graphs • Linear relationship-the relationship between the independent and dependent variable can be shown with a straight line. • Nonlinear relationship-any relationship between the variables that cannot be shown with a straight line. Direct relationship-upward sloping line Inverse relationship-downward sloping line
Model-representation of an object or a process that allows scientist to study something in greater detail.
Measurement- description that includes a number and unit SI- improved version of the metric system used worldwide. Based on multiples of 10.
Base Units • Length (m)-distance between 2 points • Mass (kg)-how much matter is in an object • Time (s)-interval between 2 events • Temperature (K or ˚C)- how hot or how cold something is • Volume (L, or cm3)-amount of space occupied by an object
Derived unit -combining different SI units Density -mass per unit volume of a material OR simply how packed together something is. The unit is g/cm3 for example: g=grams and cm3 =volume
km kilo- kilo- hecto- deka- deci- centi- milli- hm hecto dkm deka- 0.1 = 0.01 = 0.001 = m meter dm deci- cm centi- mm milli-
54 hm = ? cm km 1. Copy the # hm 2. Find Dewey 3. Move Dewey dkm m dm 54 0 0 0 0 cm x cm mm
54 hm = ? cm 540,000 cm
1 dm = ? m km 1. Copy the # hm 2. Find Dewey 3. Move Dewey dkm x m dm 1 m cm mm
1 dm = ? m .1 m • Measurements must have a # & a unit.
1 dm = ? m 0 .1 m
Scientific Notation-short way of representing very large or very small numbers
Accuracy-description of how close a measurement is to the true value of the quantity measured. Precision-the exactness of a measurement.