Download
1 / 29
290 likes | 445 Views
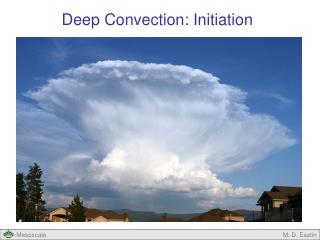
On the diagnosis of deep convection. Hamza Kabelwa Contributions from Richard H. Grumm. Overview. Overview of the key ingredients of deep convection Key stability indices and precipitable water (PW) PW drives the convection Forecast deep convection and limits of predictability.

E N D
On the diagnosis of deep convection Hamza Kabelwa Contributions from Richard H. Grumm
Overview • Overview of the key ingredients of deep convection • Key stability indices and precipitable water (PW) • PW drives the convection • Forecast deep convection and limits of predictability
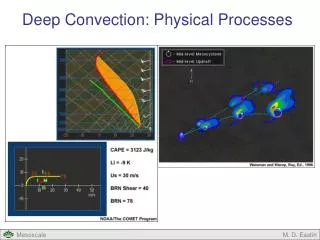
Basic Ingredients • Source of moisture best described by precipitable water (PW) • Sustains PW plumes are often associated with prolonged and record/near record events • relates to convectively available potential energy • Method to lift the air • Topography • Density boundaries • Instability maximize lift & sustain development
Classic Stability forecast Indices & Methods • The K-index • The Totals Totals Index • The Lifted Index • CAPE
The K-Index • Based on 850 to 500 hPa lapse rate to identify convective and heavy-rain producing environments as it accounts for moisture. • With contribution of 850 hPa dew point and 700 hPadewpoint depression KI = (T850-T500)+Td850-(T700-Td700) KI = (T850-T500)+Td850-(DD700)
PRE-CONVECTIVE ENVIRONMENT Satellite Derived Instability Indices Continue...... • K – Index • K index is ideally given by the formula; • K = (T850 - T500) + Td850 - (T700 - Td700) • Where; • T850= air temperature at 850hPa level • Td850 = dewpoint temperature at 850hPa level • T700= air temperature at 700hPa level • Td700= dewpoint temperature at 700hPa level • T500= air temperature at 500hPa level K index is a measure of thunderstorm potential based on vertical temperature lapse rate, moisture content of the lower atmosphere, and the vertical extent of the moist layer.
PRE-CONVECTIVE ENVIRONMENT Satellite Derived Instability Indices Continue...... • K Index in the aerological diagram....
Use of Remote Sensing in Nowcasting of Severe Weather PRE-CONVECTIVE ENVIRONMENT K = (T850 - T500) + Td850 - (T700 - Td700) Satellite Derived Instability Indices Continue...... Air temperature line Dewpoint line
K values +20 indicate some potential for air mass thunderstorms. • K values +40 indicate high chance for air mass thunderstorms development K index is a poor indicator of severe thunderstorms along the coasts and low lying areas since dry air at 700hPa may indicate convective instability. Dry air at 700hPa will give a low value to the K-Index. Use of Remote Sensing in Nowcasting of Severe Weather
KI normally above ~28-38 KI good for potential areas of convection Relates will back to QPF/rainfall when have lift and moisture Limitations when terrain above 850 hPa Good in models and in soundings
Totals Totals Index (TTI) • Stability relative to 850 hPa and 500 hPa • 2 components: • Cross Totals: CT = Td850 – T500 • Vertical Totals: VT = T850 - T500 TTI = (T850 + T850 ) – 2T500 • Focus on instability between 850 and 500 hPa with a component of moisture at 850 hPa
PRE-CONVECTIVE ENVIRONMENT Satellite derived Instability indices Continue...... TOTAL TOTALS (TT) Total Totals (TT) index is given by the formula; TT= T850 + Td850 - 2T500 Where; T850= air temperature at 850hPa level Td850 = dewpoint temperature at 850hPa level T500= air temperature at 500hPa level
PRE-CONVECTIVE ENVIRONMENT Satellite Derived Instability Indices Continue...... • TOTAL TOTALS in the aerological diagram....
PRE-CONVECTIVE ENVIRONMENT TT= T850 + Td850 - 2T500 Satellite Derived Instability Indices Continue...... Air temperature line Dewpoint line
Operational significance of TT index As with all other stability indices, there are no magic threshold value, but the following table can be used to describe the potential of the thunderstorm development in relation to its associated TT value. Use of Remote Sensing in Nowcasting of Severe Weather
PRE-CONVECTIVE ENVIRONMENT Satellite derived Instability indices Continue...... Limitations of TT Index • It does not access wind shear and CAPE directly. • In may not pick up a capping inversion that prevents storm from developing. • The index will be too stable if a layer of moisture is just under the 850hPa level. • VT may be very high and contributes to causing a high TT even when moisture is lacking. Index will be too unstable in these situations. • Works best for flat areas in low to moderate elevations • Index value interpretation varies with season and location. Use of Remote Sensing in Nowcasting of Severe Weather
Lifted Index (LI) • Lifted index is based on a parcel reaching the Lifting condensation level (LCL) then adiabatically lifting it to 500 hPa. • It is often surface or moist boundary layer based • Accounts instability based on difference LI = Tlift- T500
LIFTED INDEX (LI) The lifted index is given as a temperature difference between the environment at 500hPa level and that of a parcel of air raised from 500hPa level above the surface to the same level of 500hPa. i.e. LI = T500-TP500 The lower the value (i.e. the greater the negative number), the better the chance for thunderstorms and the greater the threat for severe weather.
PRE-CONVECTIVE ENVIRONMENT Satellite Derived Instability Indices Continue...... • LIFTED INDEX in the aerological diagram....
PRE-CONVECTIVE ENVIRONMENT LI = T500 - TP500 Satellite Derived Instability Indices Continue...... Air temperature line Dewpoint line
PRE-CONVECTIVE ENVIRONMENT Satellite derived Instability indices Continue...... Operational significance of LI • A negative LI indicates that the PBL is unstable with respect to the middle troposphere. The more negative the LI the more unstable the troposphere and the more buoyant the acceleration will be for rising parcels of air from the Planetary Boundary Layer. • The table below shows LI values with associated instability
Use of Remote Sensing in Nowcasting of Severe Weather PRE-CONVECTIVE ENVIRONMENT Satellite derived Instability indices Continue...... Strength of Lifted Index (LI) • It work best in warm season and warm sectors of the world hence very good instability parameter for tropical regions like East Africa. Limitations of Lifted Index (LI) • It only assess instability in one level, Unlike CAPE which assess instability in the troposphere as a whole.
LI Areas Low LI often have convection LI < 0 is a good starting point LI often related to CAPE and as we will see CAPE often relates to Precipitable water
The Power of Convective Available Potential Energy (CAPE) • On energy diagram • Tephi or Skew-T area proportional to energy • Integrated value and like SSI & LI a theoretical parcel is lifted adiabatically from the LCL until the equilibrium level is reached. • CAPE: convective available potential energy • Ability to produce deep updrafts • More area bigger the updraft • Can have fat or skinny CAPE
Other Parameters Associated with heavy rainfall and convection • Precipitable water (PW or PWAT) • It really drives the bus as related to rainfall and convection • Vertical Velocity • Estimated from CAPE for updraft speed • Areas of ascent in Numerical guidance which could favor releasing instability
Precipitable water drives the convection • Need to know • when PW is abnormally high • High PW source regions • PW often a proxy for CAPE • High CAPE is often co-located with high PW values • Heavy rainfall almost always associated with PW plumes
Limitations • Indices are compute with fixed levels • 850 hPa surface may be in ground • Impact KI,TTI and need to modify to a level above terrain • Indices • Not equal area • Resolution of models impacts • What we can see • And what we can predict next slide
Review/summary • Overview of the key ingredients of deep convection • Key stability indices and precipitable water (PWS) • PW drives the bus • Forecast deep convection and limits of predictability
References Convective Indices • De Coning, E. M. Koenig, and J. Olivier, 2010: The combined instability index: a new very-short range convection forecasting technique in southern Africa. J. Meteorol. Apps.,