Download
1 / 23
230 likes | 342 Views
Rainfall Type Estimation from the Information on Life Stage of Deep Convection (Feasibility of assigning the life stage of deep convection) Toshiro Inoue, Daniel Vila* and Tomoo Ushio** Meteorological Research Institute, Tsukuba, Ibaraki, Japan * INA, Buenos Aires, Argentina

E N D
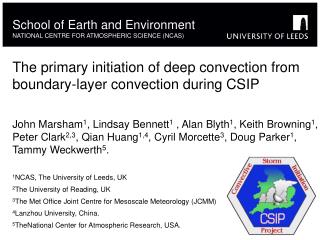
Rainfall Type Estimation from the Information on Life Stage of Deep Convection (Feasibility of assigning the life stage of deep convection) Toshiro Inoue, Daniel Vila* and Tomoo Ushio** Meteorological Research Institute, Tsukuba, Ibaraki, Japan *INA, Buenos Aires, Argentina ** Osaka Prefecture Univ., Osaka, Japan
Motivation IR rainfall estimation is less physical than PMW and PR rainfall estimation. Because IR observes just cloud instead of rain. Advantage of the IR is high temporal observation from geostationary orbit. If we can define the life stage by tracking the deep convection using high temporal observations from geostationary satellite. Then, we might use the information on the life cycle of deep convection for rainfall estimation.
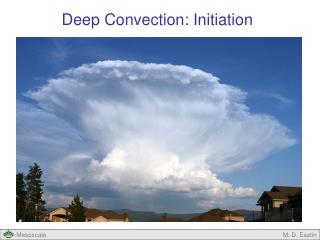
Developing Mature Decaying convective rain stratiform rain
Rainfall Rate at 2Km observed by PR/TRMM TYPE:1 Con. ; TYPE:2 Strat. ~1 mm/h ~8 mm/h
TBB-BTD Characteristics for Ice (Function of effective radius and optical thickness) Ci-Thin Ci-Thick BTD Effective Radius Cb Cu/Sc TBB Ci-Dense
MSG-IR MSG-VIS MSG-BTD Split Window Larger BTD-white Smaller BTD-black
Ci BTD>1 Cb BTD<1 253K Data GOES-W,E 0.1*0.1 Lat/Lon Grid Hourly Split Window Over Eastern Pacific, South America MSG(Meteosat-8) 0.05*0.05 Lat/Lon Grid 15 minutes Split Window Over Africa Definition of Deep Convection Cloud type (Cb, Ci) classified by the BTD within 253K cloud area.
T5 T9 T1 T6 T2 T10 T3 T7 T11 T8 T4 T12 Cloud Type Map Classified by the Split Window 15 minutes interval taken by Meteosat-8 The deep convection starts from 17:45 UTC on 24 May, 2003 to 20:35 UTC on May 24, 2003.
1° Cloud Type Map Classified by the Split Window GOES-W 2 hourly from 12UTC May 09, 2001
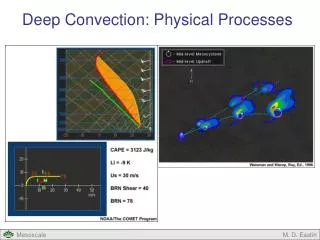
Time Evolution of Deep Convection Cloud number of Cb (blue) and Ci (green) within 253K cloud area.
Evolution of Percentage of Cb and Ci within DC The life time is short in left case, while the life time is longer in right case.
Cloud Type Map 2° Percentage of convective Rain by PR
1° Convective-rain>50% Convective-rain<50% Evolution of Cb and Ci
Summary The percentage of Ci classified by the split window within 253K cloud is a good indicator to tell the life stage for simple deep convection case from single snap shot image. We could assign different rainfall rate for the same TBB depending on the life stage.
IR BTD11-12 VIS BTD87-11