Download
1 / 24
260 likes | 491 Views
Determining the Antarctic Ice Sheet Grounding Line with Photoclinometry using LANDSat Imagery and ICESat Laser Altimetry . Jamika Baltrop and MyAsia Reid Mentor Malcolm A. LeCompte , Ph.D. Abstract.

E N D
Determining the Antarctic Ice Sheet Grounding Line with Photoclinometry using LANDSat Imagery and ICESat Laser Altimetry JamikaBaltrop and MyAsia Reid Mentor Malcolm A. LeCompte, Ph.D.
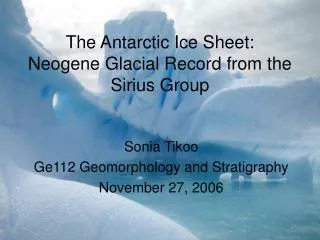
Abstract During the last century, ocean temperatures increased by approximately 1 Celsius degree. Long term observations of portions of the coastal Antarctic ice sheet reveal increasing melt rates thought to be due to the ocean temperatures increase. As a result of the warming, ice sheet margins are observed to be retreating from the edge of the ocean by approximately 1 meter per year for each 0.1°C rise in ocean temperature. The area of the Antarctic ice sheet is thus in a state of flux. As ice approaches the ocean from its landward, upslope side, it eventually enters the water and begins to float becoming an ice shelf. The relatively warm water at the base of the shelf causes it to melt into the ocean. The “Grounding Line” or GL is considered the point at which the grounded ice, in its continuous movement down-slope toward sea level elevation, enters the water and begins to float. It is more accurately referred to as the Grounding ‘Zone’ because the actually position fluctuates with tides and wave action. It is difficult to determine the actual size of the Antarctic ice sheet due to the uncertainty in the location of the GL. Making an accurate determination of its location during a narrow temporal window (perhaps a 3-5 year interval) would be useful in estimating the mass-balance of the southern ice sheet simply by providing a perimeter across which the ice enters the water at a rate of 1 meter per year. This can be compared with the amount of precipitation observed to occur over the continental ice sheet. Photoclinometry software obtained from NASA Goddard Space Flight Center is used to determine the geographic location of the GL. Photoclinometry uses differences in the surface brightness of LANDSAT scenes of coastal Antarctic, corrected for variations in solar illumination angle to determine relative slopes in a scene. The slopes are adjusted to actual elevations by associating brightness levels with actual elevations along scan paths of the GLAS (Geoscience Laser Altimetry System) laser altimeter GL terrain brightness is then compared between scan paths to produce an elevation map of a scene. The team derived an assigned portion of the Antarctic Ice Sheet GL along the coastline recorded by a LANDSat scene centered at 120° West longitude. LANDSat imagery is obtained from an on-line archive operated by the US Geological Survey. ICESat/GLAS laser altimetry data is obtained from the National Snow and Ice Data Center website.
Agenda • What is the purpose? • Why are we determining the Grounding Line? • How will we determine the Grounding Line? • Results • Future Works
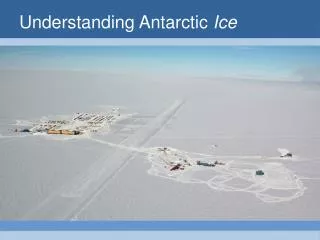
What is the purpose? • define the Antarctic Grounding Line; the edge of the grounded ice sheet versus that which is afloat .
Why are Determining the Grounding Line? • To determine the extent of the grounded ice that is now available for melting (and might be available to raise sea level) • To help determine the amount of melting that is occurring. • This is called the "mass balance" and is the difference between the snow that is accumulating inland and the melting that is occurring at the margin of the ice sheet.
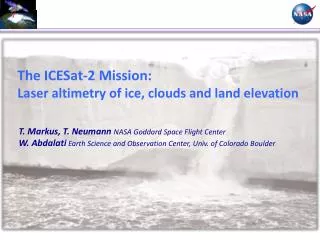
How will we determine the Grounding Line? • Using software that allows topography to be determined from satellite images and satellite-based laser altimeter measurements of terrain elevation.
What is “Topography?" • Is actual elevations of any surface; a 2 dimensional representation of a 3 dimensional surface. • Contour lines are drawn representing set elevation intervals. (e.g.: every 100 meters) • The range of the intervals represent the full of range of the elevations in a scene.
ASAID Training • The NASA Goddard Space Flight Center in Greenbelt, MD, provided IDL Software and trial data sets including: • LANDSAT Image • GLAS Altimetry Profiles • NASA Goddard also provides a set of step by step procedures to assist learning how to define the Antarctic Grounding Line.
Landsat Images • A complete coverage set of Landsat images were collected from the Landsat Image Mosaic of Antartica(LIMA) project and orthorectified at http://lima.usgs.gov. • The teams assignment was to define the grounding line along the coast from 17W to 25 W Longitude.
Landsat Images • This returns the exact scene used for the pixel the cursor is on when the left button is clicked. • The acquisition date • Path and row numbers are returned.
ASAID Training The software… • Determines the "shape" of the terrain from changes in illumination (relative lighting or shading). • Combines the shape with measurements of elevation from satellite lasers along the lines that cross the imaged terrain at least twice.
ASAID Training • The elevations across the intervening area (for which there are no elevation measurements) are then interpolated between the two tracks. • The mathematical technique to accomplish the topographical mapping is called “Photoclinometry" but is more commonly referred to as "Shape from Shading".
Analysis Tools • ASAID Training Package • Data and Software provided with a cookbook approach. • IDL Software • LANDSAT_SUBSET_INFO • Displays full LANDSAT image (too large) and GLAS tracks • Allows determining sub-image crop points • Enter crop points in input file • GLAS_REFERENCE_TRACK_VIEWER • Displays the cropped LANDSAT image and GLAS tracks • Identifies GLAS data to obtain/use. • Download geographically appropriate GLAS data • GLAS_DATA_TRIMMER • Trims the GLAS data to just that data crossing the subset image.
Landsat Image & GLAS Reference Orbit Ground Tracks • Identify the GLAS ground tracks that pass through the Landsat images. • Identify cropping of the image to reduce the file size. • The file name “Reorbit_91DAY_40HZ.ZIP” contains the GLAS Reference Orbit Ground Track System (reference tracks.)
GLAS Reference Track Viewer • Displays the sub imae • Identify cropping of the image to reduce the file size. • The file name “Reorbit_91DAY_40HZ.ZIP” contains the GLAS Reference Orbit Ground Track System (reference tracks.)
Analysis Tools • GLAS_DATA_VIEWER • Each cycle of GLAS data is displayed for a single GLAS reference track. • Select the best cycle (GLAS elevation profile) for photoclinometry processing. • Enter selected cycle file name into input file • PHOTOCLINOMETRY • Generate elevation field between GLAS tracks. • ROI_TOOL • Interactively creates a grounding line • Geographic coordinates stored in text file.
GLAS Data Viewer • Examines all the cycles of a single reference track as a group before processing to the next reference track. • The sub image is the copy of itself with the super imposed longitude and latitude reference track number. • The left image shows the elevation versus the latitude.
Photoclinometry • is the process by which a 2 dimensional image of a surface is transformed into a surface map that represents different levels of elevation. • It uses the shadows and light directions as reference points. It is used mostly to depict the surface of sculptures, to give an idea of how it would look 3 dimensional. • The techniques depend on very specific conditions, especially light direction.
ROI TOOL • ROI (Region of Interest) Tool allowed the grounding line to be drawn • The results were placed in a grounding line file. • The user specifies the directory containing the data to be analyzed. • Path and Row name • The program reads the sub-image, metadata, and elevation fields. • It returns a set of displays of the previous step • Sub image, and map of elevation fields
Results • Software to provide photoclinometric analysis of the ice sheet surface topography was under continuous development during the 2008-2009 academic year. • In addition to ASAID software training, the team’s primary activities during this period were photoclinometry software test and evaluation. • The software finally reached a state of operational readiness at the end of March 2009. • While grounding lines were successfully defined on the Antarctic coast present in the LANDSAT image supplied as part of the training package, the future team will build on their efforts to apply knowledge on the assigned coastlines.
Conclusion • We used our skills and knowledge to complete the training, and will ultimately determine the grounding line.
Future Work • Our future works will be to continue to map the Antarctic grounding line. • We will also use the newly updated software and correct files to map and produce a final grounding line.
References • “U.S. Geological Survey: Landsat Image Mosaic of Antarctica (LIMA)” , http://lima.usgs.gov. • “National Snow and Ice Data Center: ICESat/GLAS Data”, http://nsidc.org/data/icesat/order.html. • Robert , Bindchandler, and Ian Joughin. Total Antarctic Ice Sheet Discharge: An IPY Benchmark Data Set. • R.L., Kirk, J.M. Barrett, and L.A. Soderblom. Photoclinometry Made Simple...?. 2003. • Robert, Bindchandler, and HyeunguChoi. Mapping the Total Antarctic Ice Sheet Discharge: an IPY Benchmark Data Set. • wordnet.princeton.edu/perl/webwn • http://www.nasaimages.org/luna/servlet/detail/NVA2%7E13%7E13%7E23247%7E123788:First-HiRISE-Image-of-Mars--Topogra