Download

1 / 140
1.42k likes | 1.6k Views
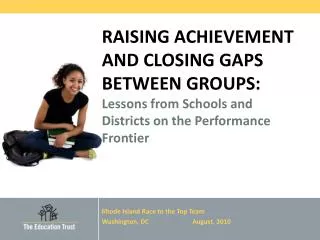
ACCESS TO SUCCESS: Lessons from Colleges and Universities on the Performance Frontier. Colorado State University Pueblo Pueblo, CO April, 2011. Over past 25 years, we’ve made a lot of progress on the access side. Immediate College-Going Up.

E N D
ACCESS TO SUCCESS:Lessons from Colleges and Universities on the Performance Frontier Colorado State University Pueblo Pueblo, CO April, 2011
Over past 25 years, we’ve made a lot of progress on the access side.
Immediate College-Going Up NCES, The Digest of Education Statistics 2009, Table 201.
Most High School Grads Go On To Postsecondary Within 2 Years Source: NCES, “Education Longitudinal Study of 2002 (ELS:2002): A First Look at the Initial Postsecondary Experiences of the Sophomore Class of 2002 (NCES 2008-308).” 2007, Table 3.
Immediate* College-Going Increasing for All Racial/Ethnic Groups: 1980 to 2008 *Percent of high school completers who were enrolled in college the October after completing high school NCES, The Digest of Education Statistics 2009, Table 201.
College-Going Generally Increasing for All Income Groups NCES, The Condition of Education, 2009- Indicator 21: Supplemental Table A-21-1.
But though college-going up for minorities, gains among whites have been greater
All Groups Up in College-Going from 1980 to 2008, But Gaps Also Increase NCES, The Digest of Education Statistics 2009, Table 201.
And though college going up for low-income students, they still haven’t reached rate of high income students in mid-seventies.
College-Going Rates by Family Income NCES, The Condition of Education 2009. Indicator 21- Table A21-1.
But access isn’t the only issue: There’s a question of access to what…
Distribution of Beginning Postsecondary Students by Institutional Type and Race/Ethnicity, 2003-04 Source: EdTrust Analysis of BPS:04/06, May 2010
Black and Latino Freshmen Complete College at Lower Rates Than Other Students 6 -Year Completion Rates for Fall 2002 Cohort at All 4-Year Institutions Source: NCES (April 2010). First Look: Enrollment in Postsecondary Institutions, Fall 2008; Graduation Rates, 2002 and 2005 Cohorts; and Financial Statistics Fiscal Year 2008. http://nces.ed.gov/pubs2010/2010152rev.pdf
And from 2-year institutions? Lower still.
Low Completion Rates for All Students at Community Colleges 3 -Year Completion Rates for Fall 2005 Cohort at Public 2-Year Institutions Source: NCES (April 2010). First Look: Enrollment in Postsecondary Institutions, Fall 2008; Graduation Rates, 2002 and 2005 Cohorts; and Financial Statistics Fiscal Year 2008. http://nces.ed.gov/pubs2010/2010152rev.pdf
The result? Increases in college completion not commensurate with increases in college going.
College Going vs. Completion of BA or Higher, White (Age 25-29) +22 +13 NCES, The Digest of Education Statistics 2009, Table 201. and Current Population Survey, Table A-2. Percent of People 25 Years and Over Who Have Completed High School or College, by Race, Hispanic Origin and Sex: Selected Years 1940 to 2009.
College Going vs. Completion of BA or Higher, African American (Age 25-29) +13 +9 NCES, The Digest of Education Statistics 2009, Table 201. and Current Population Survey, Table A-2. Percent of People 25 Years and Over Who Have Completed High School or College, by Race, Hispanic Origin and Sex: Selected Years 1940 to 2009.
College Going vs. Completion of BA or Higher, Latino (Age 25-29) +12 +5 NCES, The Digest of Education Statistics 2009, Table 201. and Current Population Survey, Table A-2. Percent of People 25 Years and Over Who Have Completed High School or College, by Race, Hispanic Origin and Sex: Selected Years 1940 to 2009.
Different groups of young Americans obtain degrees at very different rates.
Some Americans Are Much Less Likely to Graduate From College Current Population Survey, Table A-2. Percent of People 25 Years and Over Who Have Completed High School or College, by Race, Hispanic Origin and Sex: Selected Years 1940 to 2009.
Some Americans Are Much Less Likely to Graduate From College Postsecondary Education Opportunity, “Bachelor’s Degree Attainment by Age 24 by Family Income Quartiles, 1970 to 2008.
These rates threaten health of our democracy. But even for those who don’t care much about that, they are particularly worrisome, given which groups are growing…and which aren’t.
Growth Differs Substantially by Group Millions Data for all races exclude Hispanics. Population Division, Population Projections, U.S. Census Bureau. Released 2008.
Not surprisingly, our international lead is slipping away We’re still relatively strong (although no longer in the lead) with all adults.
United States 4th Out of 30 OECD Countriesin Overall Postsecondary Attainment United States (40%) OECD, Education at a Glance 2009, Table A1.3a, http://www.oecd.org/document/62/0,3343,en_2649_39263238_43586328_1_1_1_1,00.html
United States Tied for 10th Out of 30 OECD Countries in Postsecondary Attainment of Younger Workers United States (40%) OECD, Education at a Glance 2009, Table A1.3a, http://www.oecd.org/document/62/0,3343,en_2649_39263238_43586328_1_1_1_1,00.html
United States: Not Much Difference in Postsecondary Attainment Levels of Youngest and Oldest Generations United States (2) OECD, Education at a Glance 2009, Table A1.3a, http://www.oecd.org/document/62/0,3343,en_2649_39263238_43586328_1_1_1_1,00.html
WHAT’S GOING ON? Many in higher education would like to believe that these patterns are mostly a function of lousy high schools and stingy federal and state policymakers.
Low Income and Minority Students Continue to be Clustered in Schools where we spend less…
National Inequities in State and Local Revenue Per Student Education Trust analyses based on U.S. Dept of Education and U.S. Census Bureau data for 2005-06
Students in Poor Schools Receive ‘A’s for Work That Would Earn ‘Cs’ in Affluent Schools Prospects (ABT Associates, 1993), in “Prospects: Final Report on Student Outcomes”, PES, DOE, 1997
African American, Latino, Native American H.S. Grads Less Likely to Have Been Enrolled in Full College Prep Track Note: Full College Prep track is defined as at least: 4 years of English, 3 years of math, 2 years of natural science, 2 years of social science and 2 years of foreign language. J. Greene, Public High School Graduation and College Readiness Rates in the United States, Manhattan Institute (2003)
Core classes in high-poverty and high-minority secondary schools are more likely to be taught by out-of-field teachers High Poverty Low Poverty High Minority Low Minority Note: Data are for secondary-level core academic classes (Math, Science, Social Studies, English) across United States. High-poverty ≥75% of students eligible for free/reduced-price lunch. Low-poverty school ≤15% of students eligible. High-minority ≥ 75% students non-white. Low-minority ≤ 10% students non-white. The Education Trust, Core Problems: Out-of-Field Teaching Persists in Key Academic Courses and High-Poverty Schools, (2008)
Students at high-minority schools are more likely to be taught by novice teachers Note: Novice teachers are those with three years or fewer experience. High-minority ≥ 75% students non-white. Low-minority ≤ 10% students non-white. Analysis of 2003-2004 Schools and Staffing Survey data by Richard Ingersoll, University of Pennsylvania (2007)
While we’re making some progress in addressing these problems in elementary and middle schools…
4th Grade Reading:Record Performance with Gap Narrowing *Denotes previous assessment format NAEP 2008 Trends in Academic Progress, NCES
4th Grade Math:Record Performance with Gap Narrowing *Denotes previous assessment format NAEP 2008 Trends in Academic Progress, NCES
8th Grade Math: Progress for All Groups, Some Gap Narrowing *Denotes previous assessment format NAEP 2008 Trends in Academic Progress, NCES
We have not yet turned the corner in our high schools. Overall achievement levels are flat and gaps between groups are wider today than they were in 1990.
Achievement flat in reading * Denotes previous assessment format National Center for Education Statistics, NAEP 2008 Trends in Academic Progress
Achievement flat in math * Denotes previous assessment format National Center for Education Statistics, NAEP 2008 Trends in Academic Progress
12th Grade Reading: No Progress, Gaps Wider than 1988 *Denotes previous assessment format NAEP 2008 Trends in Academic Progress, NCES