Download
1 / 120
1.2k likes | 1.33k Views
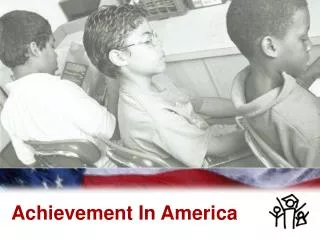
ACCESS TO SUCCESS IN AMERICA: What do the data tell us? . Access to Success Provosts Meeting Baltimore, MD January 9, 2014. America: Two Enduring Stories. 1. Land of Opportunity :. Work hard, and you can become anything you want to be.

E N D
ACCESS TO SUCCESS IN AMERICA: What do the data tell us? Access to Success Provosts Meeting Baltimore, MD January 9, 2014
1. Land of Opportunity: Work hard, and you can become anything you want to be.
2. Generational Advancement: Through hard work, each generation of parents can assure a better life — and better education — for their children.
These stories animated hopes and dreams of people here at home And drew countless immigrants to our shores
Yes, America was often intolerant… And they knew the “Dream” was a work in progress.
We were: • The first to provide universal high school; • The first to build public universities; • The first to build community colleges; • The first to broaden access to college, through GI Bill, Pell Grants, …
Percent of U.S. adults with a high school diploma 1920 1940 1960 2000 2012 1980
Percent of U.S. adults with a B.A. or more 1920 1940 1960 1980 2000 2012 4% 6% 11% 31% 23% 29% Source: U.S. Census Bureau, Educational Attainment in the United States: 2012, Table 2.
Progress was painfully slow, especially for people of color. But year by year, decade by decade…
Percent of U.S. adults with a high school diploma, by race 1940 1920 1960 1980 2000 2012
Percent of U.S. adults with a B.A. or more, by race 1940 1960 1980 2000 2012 1920
Then, beginning in the eighties, inequality started growing again.
Wealthiest US households take greater share of income, while poorest 20% fall backwards Source: U.S. Census Bureau, Current Population Survey Annual Social and Economic Supplements, Table H-2. Share of Aggregate Income Received by Each Fifth and Top 5 Percent of Households, All Races: 1967 to 2012.
In the past four years alone, 95% of all income gains have gone to the top 1%. Source: Stiglitz, “Inequality is a Choice,” New York Times, October 13, 2013.
Instead of being the most equal, the U.S. has the third highest income inequality among OECD nations. United States Note: Gini coefficient ranges from 0 to 1, where 0 indicates total income equality and 1 indicates total income inequality Source: United Nations, UN Data 2012, http://data.un.org/DocumentData.aspx?q=income+inequality&id=328
U.S. intergenerational mobility was increasing until 1980, but has sharply declined since. Source: Daniel Aaronson and BhashkarMazumder. Intergenerational Economic Mobility in the U.S.,1940 to 2000. Federal Reserve Bank of Chicago WP 2005-12: Dec. 2005.
Poverty even “stickier” for some. Among those starting in the bottom quintile of income, 32% of whites will remain, compared with 63% of blacks. Source: Tom Hertz. Understanding Mobility in America. Center for American Progress: 2006.
The US now has one of lowest rates of intergenerational mobility Source: Corak, Miles. Chasing the Same Dream, Climbing Different Ladders. Economic Mobility Project; Pew Charitable Trusts, 2010.
At macro level, better and more equal education is not the only answer. But at the individual level, it really is.
Overwhelming message about what matters in turning this around? Education. “Among those who have finished four years of college, there is no racial gap in economic mobility. Both whites and blacks experience very high rates.” Source: Upward Intergenerational Mobility in the US. Pew Trusts.
College-educated adults earn more Note: Earnings data are based on full-time, year-round workers age 25 and older • Source: Bureau of Labor Statistics, Annual Social and Economic Supplement, PINC-03. Educational Attainment--People 25 Years Old and Over, by Total Money Earnings in 2012, Work Experience in 2012, Age, Race, Hispanic Origin, and Sex, http://www.census.gov/hhes/www/cpstables/032013/perinc/pinc03_000.htm
And are less likely to be unemployed Source: Bureau of Labor Statistics, Employment status of the civilian non-institutional population 25 years and over by educational attainment, sex, race, and Hispanic or Latino ethnicity, 2012.
College graduates more likely to vote Note: Data include both those who are and are not registered to vote. Source: The College Board, Education Pays 2013.
College graduates more likely to volunteer Note: Data represent percentage of total population that reported volunteering during the year ending September 2012 Source: The College Board, Education Pays 2013.
College Grads of all races far more likely to be in “Very Good” or “Excellent” Health Robert Wood Johnson Foundation Commission for a Healthier America, 2009
College Grads Even Have Better Mental Health • Source: Gallup, “Strong Relationship Between Income and Mental Health” (2007)
What schools and colleges do, in other words, is hugely important to our economy, our democracy, and our society.
Over past 30 years, we’ve made a lot of progress on the access side.
Immediate College-Going Up Note: Percent of high school completers who were enrolled in 2-year or 4-year college the October after completing high school Source: NCES, The Digest of Education Statistics 2013 (Table 302.10).
Immediate College-Going Increasing for All Racial/Ethnic Groups: 1972 to 2012 Note: Percent of high school completers who were enrolled in college the October after completing high school Source: NCES, The Digest of Education Statistics 2013 (Table 302.20).
College-Going Generally Increasing for All Income Groups Note: Percent of high school completers who were enrolled in college the October after completing high school Source: NCES, The Condition of Education 2010 (Table A-20-1) and The Digest of Education Statistics 2013 (Table 302.30).
But though college-going up for students of color, gains among whites are often larger…
Low-Income Students Today Still Not Reaching the College-going Rate for High-Income Students in 1972… Note: Data for black, Hispanic, and low-income represent two-year moving average because of small sample sizes. Source: NCES, The Condition of Education 2010 (Table A-20-1) and The Digest of Education Statistics 2013 (Table 302.30)
But access isn’t the only issue: There’s a question of access to what…
Students of Color and Pell recipients more likely to begin at for-profits and community colleges Source: Ed Trust analysis of IPEDS Fall enrollment, Fall 2012 (by race) and IPEDS Student Financial Aid survey, 2011-12 (by Pell recipient status).
Black, Latino, and American Indian Freshmen Complete College at Lower Rates Than Other Students 6 -year bachelor’s completion rates for first-time, full-time freshmen, Fall 2006 cohort at 4-year institutions Source: NCES (December 2013). Enrollment in Postsecondary Institutions, Fall 2012; Financial Statistics, Fiscal Year 2012; and Graduation Rates, Selected Cohorts, 2004-2009, First Look (Provisional Data) Table 3.
Graduation rates at public community colleges Source: NCES (Dec. 2013). First Look: Enrollment in Postsecondary Institutions, Fall 2012; Financial Statistics, Fiscal Year 2012; and Graduation Rates, Selected Cohorts, 2004-2009, First Look (Provisional Data) Table 3.
Chance of attaining a bachelor’s degree within six years, among students who begin at community college?
Only 14 percent. Percent of students who started at a community college intending to earn a Bachelor’s in 2003 and earned a BA degree by 2009 Source: U.S. Department of Education, National Center for Education Statistics, 2003-04 Beginning Postsecondary Students Longitudinal Study, First Follow-up (BPS:04/06).
Different groups of young Americans obtain degrees at very different rates.
Whites attain bachelor’s degrees at nearly twice the rate of blacks and almost three times the rate of Hispanics Source: NCES, Condition of Education 2010 (Table A-22-1) and U.S. Census Bureau, Educational Attainment in the United States: 2012