Download
1 / 22
220 likes | 223 Views
This workshop aims to explore how water management is perceived by stakeholders, using a participative approach to uncover mental models and address conflicting demands. Through the use of a comprehensive questionnaire, we will analyze the perceived criticality of various water management issues and apply multivariate analysis to untangle correlated variables. The workshop will also focus on identifying independent dimensions and developing synthetic indicators for further analysis. This workshop aims to promote a better understanding of stakeholders' perspectives and facilitate informed decision-making in water management.

E N D
From Problem Statement to Baseline Scenario: Replies to Water Issues Questionnaire Ugo Gasparino, Barbara Del Corpo OPTIMA Regional Workshop, Qawra, Malta, 28-29 | 05 | 07
Participative Approach economic efficiency, social equity, environmental compatibility multidimensional problem + conflicting demands by different stakeholders • ‘discover’ and‘measure’ how water management tends to be perceived by Stakeholders
Mental Models people use ‘mental models’ for making sense of the complexity of the world mental models are used to translate incoming information and filter it selectively • these models differ between individuals and groups in terms of information content and structure. This difference may inhibit communication, and could be one reason for the non-adoption of technologies and management recommendations
Complementary Approaches Complementary approaches
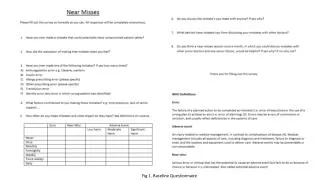
‘soft’ Approach Methodology based on interviewing Stakeholders (as typical in ‘soft’ social sciences) • Generate and submit to the Stakeholders a Questionnaire, containing a comprehensive list of Issues - ask them to score the perceived criticality of each Issue (‘Extremely Unimportant’ ‘Extremely Important’)
TheQuestionnaire • The questionnaire is structured into three main components: • Water management (e.g., water institutions, water regulation, allocation and tariff structures, stakeholder participation, investments in infrastructures, technologies and research, …) • Water demand • Water supply (state, impacts, efficiency of the allocation systems and infrastructures, biodiversity, limits to economic development and ‘quality of life’, …) • plus Physical characteristics (Water scarcity, Floods, Droughts, Groundwater availability, Watershed degradation, Coastal interaction) • It addresses both quantitative and qualitative issues • It addresses both static and dynamicissues
OPTIMA application Extremely Very Unimportant Neutral Important Very Extremely unimportant unimportant important important Don’t know 64 Issues in the Questionnaire • Symmetric 7-point ordinal scale ordered categories: • from ‘extremely unimportant’ to ‘extremely important’ (+ ‘missing values’) rank ordering of observations rather than precise measurements.
‘soft’ Approach Methodology based on interviewing Stakeholders (as typical in ‘soft’ social sciences) • Generate and submit to the Stakeholders a Questionnaire, containing a comprehensive list of Issues - ask them to score the perceived criticality of each Issue (‘Extremely Unimportant’ ‘Extremely Important’) • Analyze the correlation matrix of the scores assigned to different Issues
Multivariate Analysis Methodology based on interviewing Stakeholders (as typical in ‘soft’ social sciences) • Generate and submit to the Stakeholders a Questionnaire, containing a comprehensive list of Issues - ask them to score the perceived criticality of each Issue (‘Extremely Unimportant’ ‘Extremely Important’) • Analyze the correlation matrix of the scores assigned to different Issues • Apply explorative factor analysis to ‘untangle’ the overlapping information provided by the correlated variables and peer beneath the surface. Extraction of an ‘optimal’ number of orthogonal (i.e., independent) dimensions (weighted sums of subgroups of Issues)
‘soft’ Approach Methodology based on interviewing Stakeholders (as typical in ‘soft’ social sciences) • Generate and submit to the Stakeholders a Questionnaire, containing a comprehensive list of Issues - ask them to score the perceived criticality of each Issue (‘Extremely Unimportant’ ‘Extremely Important’) • Analyze the correlation matrix of the scores assigned to different Issues • Apply explorative factor analysis to ‘untangle’ the overlapping information provided by the correlated variables and peer beneath the surface. Extraction of an ‘optimal’ number of orthogonal (i.e., independent) dimensions (weighted sums of subgroups of Issues) • Interpret the discovered ‘underlying structure’ and use this reduced set of dimensions in further analysis (e.g., cross-comparisons, ‘synthetic indicators’, …)
OPTIMA application • Collected data: • ‘Issues Questionnaire’ compiled by 75 Stakeholders in seven case studies: • Dhiarzos • Gediz • Litani • Martil • Melian • Wadi Zeimar / Alexander • Zarqa
Global view • The respondents prevalently select ‘important’, ‘very important’ and ‘extremely important’ scores. [Fewer people answered on the ‘unimportant’ branch of the scale]. 6%
Perceived Issues 4 independent (orthogonal) factors • 1st factor: ‘Pressure’ and ‘impact’ on water demand and quality, mainly related to non-agricultural ‘driving forces’(tourism, household, industry) • Includes growth of ‘driving forces’ and unsatisfactory infrastructure – agriculture perceived as unavoidable • 2nd factor: Deficiencies in the regulatory and institutional ‘response’, mainly in relation with Agriculture • Includes overlap, conflict, fragmentation of competences, lack of participation, water standards and rights • 3rd factor: Techno-economical barriers and (industrial) impact on water quality (limiting its further use due to ‘too low’ quality) • Includes obsolete technologies, maintenance and techno-economical barriers • 4th factor: ‘Subventioned’ water price (agriculture and household) • ‘too low’ water price, with respect to the implementation of a ‘full cost recovery’
Classification of perceived priorities Methodology based on interviewing Stakeholders (as typical in ‘soft’ social sciences) • Generate and submit to the Stakeholders a Questionnaire, containing a comprehensive list of Issues - ask them to score the perceived criticality of each Issue (‘Extremely Unimportant’ ‘Extremely Important’) • Analyze the correlation matrix of the scores assigned to different Issues • Apply explorative factor analysis to ‘untangle’ the overlapping information provided by the correlated variables and peer beneath the surface. Extraction of an ‘optimal’ number of orthogonal (i.e., independent) dimensions (weighted sums of subgroups of Issues) • Interpret the discovered ‘underlying structure’ and use this reduced set of dimensions in further analysis (e.g., cross-comparisons, ‘synthetic indicators’, …) • Classify on this discovered ‘scale’ the priorities perceived by (different groups of) Stakeholders in the different case studies
within- vs. between-variance JOR PAL TUN MOR LEB TUR CYP less critical more critical (non-agricultural) ‘pressure’ and ‘impact’ on water demand and quality
classification - discrimination Deficiencies in the regulatory and institutional ‘response’ (non-agricultural) ‘pressure’ and ‘impact’ on water demand and quality
(dis)similarities Multidimensional Scaling (MDS)* *Mahalanobis distance, based on the pooled within-group covariance matrix
Stakeholders’ priorities Stakeholder ‘scale’ less critical more critical (non-agricultural) ‘pressure’ and ‘impact’ on water demand and quality
Summary and Conclusions • The approach assumes that the perception of water management is based on a ‘mental model’, with a limited number of dimensions. • Aim of the procedure is to discover and ‘bring to the surface’ these ‘mental models’, through an ‘ad hoc’ Questionnaire. • The ‘elicitation’ of the ‘priorities’, as perceived by different (groups of) Stakeholders, can facilitate communication as it allows to focus on the Issues perceived as ‘most critical’.
Summary and Conclusions • A four-dimensional orthogonal ‘latent structure’ ‘tends to emerge’ from the statistical analysis(however, due to the relatively small sample size, the generality of the result cannot be ‘guaranteed’, i.e., it could be, at least partially, ‘data specific’ and not emerge in other ‘equivalent samples’). • The 4 factors allow a classification/discrimination among the different Case Studies/Stakeholders.
Water issues questionnaire http://www.ess.co.at/OPTIMA/FTP/D01.pdf Statistical analysishttp://www.ess.co.at/OPTIMA/FTP/D02.pdf Working Paper http://www.feem.it/Feem/Pub/Publications/WPapers/default.htm Acknowledgments We would like to thank all OPTIMA partners for fruitful discussions and for taking care of the compilation of the Questionnaires, by interviewing local Stakeholders. corso Magenta 63 20123 Milano - Italy tel +39 | 02 | 5203.6975 fax +39 | 02 | 5203.6946 web http://www.feem.it