Download
1 / 11
110 likes | 114 Views
What does “spatial resolution” mean? Some answers using MARGINS data. DATA from the University of New Hampshire's Centre for Coastal and Ocean Mapping Marianas Western Insular Margin The maps have been generated by “GeoMapApp,”: http://www.geomapapp.org. Juan Baztan

E N D
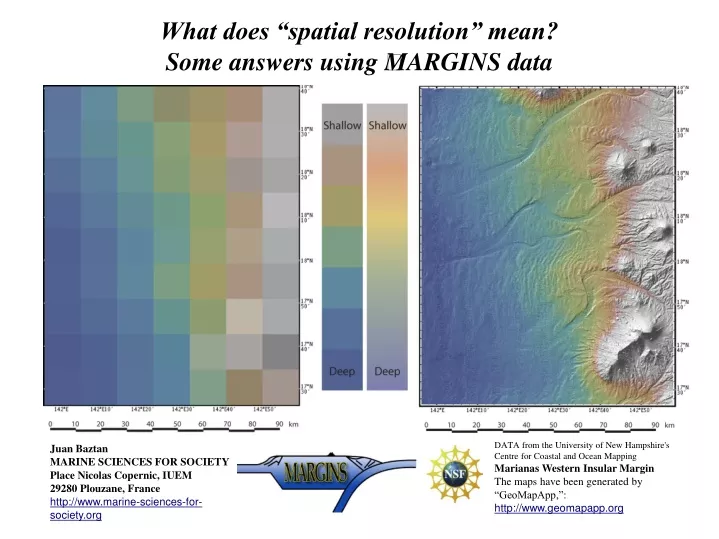
What does “spatial resolution” mean? Some answers using MARGINS data DATA from the University of New Hampshire's Centre for Coastal and Ocean Mapping Marianas Western Insular Margin The maps have been generated by “GeoMapApp,”: http://www.geomapapp.org Juan Baztan MARINE SCIENCES FOR SOCIETY Place Nicolas Copernic, IUEM 29280 Plouzane, France http://www.marine-sciences-for-society.org
What does “spatial resolution” mean? Definitions as introduction: The “spatial resolution” is a measure of the smallest area identifiable on the image. Resolution refers to the sharpness of an image, to the capability of making the individual parts distinguishable. The unit of information is a Pixel. ? A pixel A surface with 9 pixels A surface with 63 pixels
What does “resolution” mean? The pixels are arranged in a grid: The grid defines geographic space as an array of points arranged in rows and columns. This image is generated from the grid with 80 points, 8 columns and 10 rows. The image has 63 pixels A grid with 8 columns and 10 rows
What does “resolution” mean? How do MARGINS scientists built images from the sea floor? What is the resolution of those images? The oceanographers draw the images of the sea floor by collecting points, then generating grids. Each point of a grid has three values: (X, Y, Z) (column, row, value) (longitude, latitude, water depth) The position is done by the number of the column and the number of the row (X, Y). In a map, the rows indicate the latitude and the columns the longitude. Y, r o w s, l a t i t u d e X, columns, longitude
What does “resolution” mean? How do oceanographers collect the “points” from the sea floor? Two main methods: Satellite Altimetry Multibeam echo sounder A GRID OF THE SEA FLOOR For more info please see slide 10. “Calculates” 1 point every 1 minute latitude, that is every 1,852 km “Samples” 1 point every meter One pixel = 1,2 miles One pixel = 1 meter ... 3' 2' Satellite Altimetry Multibeam echo sounder 1' 0' 0 1 2 3 ...
What does “resolution” mean? It means that we can have representations of different resolutions for the same surface of the sea floor Low resolution Medium resolution Therefore, the resolution is related to the quantity of points on a surface, equivalent to the size of the pixels. Points and pixels indicate the quantity of information.
What does “resolution” mean? BUT: What's this colored image?? ?? When we increase the number of points,we increase the quantity of data, we decrease the size of the pixels, we increase the resolution and we can recognize some features like volcanoes and submarine valleys. This is the sea floor in Marianas Western Insular Margin
Some exercises about “resolution” Using this example of the Marianas Western Insular Margin, four questions: How many points are in the grid? How many pixels in the image? What is the size of a pixel? What is the size of the study area? Can you imagine the seascape? Find 5 volcanoes and 2 submarine valleys Remember: each point of the grid has three values: X, Y, Z X and Y relate to the position, Z relate to the depth.
Some exercises about “resolution” This example of the Marianas Western Insular Margin has a grid with 1540 points. submarine valley The image has 1386 pixels volcano volcano Some volcanoes and submarine valleys are indicated. submarine valley Can you imagine your classroom at the same resolution? Try to draw your classroom in a grid with 1540 points: 35 columns by 44 rows. volcano volcano volcano At this point you realize that this is not a very good resolution ... How can we improve the resolution?
An open question Increasing the number of points, reducing the size of the pixels, we improve the quality of the image In this image we have one point every 100 m. This resolution is obtained only in very few places of the world's oceans. The global grid stems from the satellite "predicted bathymetry" one point every 2 kilometers, the sea floor is not measured but calculated. http://topex.ucsd.edu/marine_topo/text/topo.html ... But! a medium grain of sand measures 1 mm. DATA from the University of New Hampshire's Centre for Coastal andOcean Mapping Marianas Western Insular Margin The maps have been generated by “GeoMapApp,”: http://www.geomapapp.org What do we really know about the sea floor? Very little! The main part of the world's oceans' surface remains unknown in its detail.
Other tasks to perform about resolution: * In the data base mentioned below, find the study area of the Marianas Western Insular Margin: http://www.geomapapp.org or inhttp://www.virtualocean.org Which surveys have been done in this area? What is the resolution of the study area's available grids? * Make a longitudinal profile from the deepest part of the study area to the shallowest. Compare this profile, in terms of resolution, with the one used in Laura Reiser's minilesson: “Profiling Earth's Surface using GeoMapApp“ * Make groups of 3 or 4 students each. Using http://www.geomapapp.org or http://www.virtualocean.org, search the whole planet for: (i) the area mapped with the highest resolution, (ii) the the area mapped with the lowest resolution and (iii) a zone with intermediate resolution. Each group has to think of 3 examples taken from daily life in terms of standard of resolution (for example if the resolution is two meters, the object can be a car). * How is it possible to improve the resolution of the data from our planet's submarine part?