Download
1 / 34
390 likes | 801 Views
GIS Data Management. Theresa Valentine Andrews LTER. Spatial Data/Software Finding Existing Data to Meet your Research Goals Special consideration for archiving and publishing spatial datasets Documenting spatial datasets Managing Study Site Locations Demo Exercise. GIS Data Management.

E N D
GIS Data Management Theresa Valentine Andrews LTER
Spatial Data/Software Finding Existing Data to Meet your Research Goals Special consideration for archiving and publishing spatial datasets Documenting spatial datasets Managing Study Site Locations Demo Exercise GIS Data Management
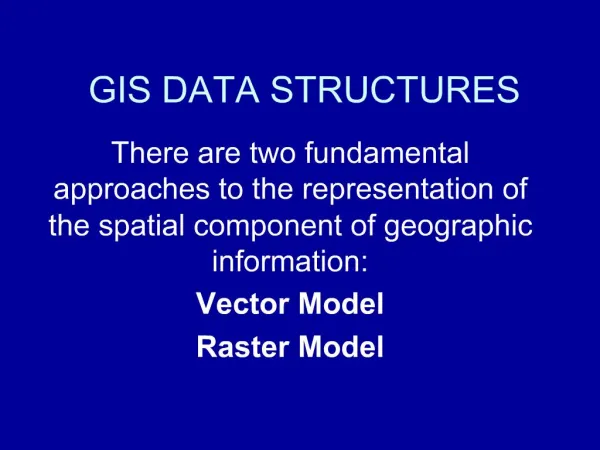
Spatial Data Geometry Associated Attributes Projections Software Formats Exchange Formats ESRI GIS Software ArcGIS data types ArcGIS Desktop Modules Spatial Data/Software
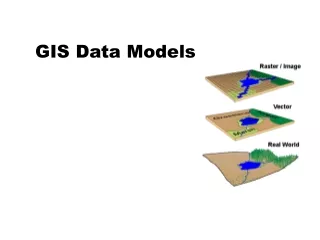
Spatial Data Geometry row Column polygon Pixel Pixel value line point • Raster (grids, images) • Vector (lines, points, • polygons)
Describes characteristics of the spatial features • Stored in database file • Metadata describes each attribute (code = biomass, range of values, etc). Associated Attribute Data
Attribute File is linked to the spatial data. You can select record in table and view on map, or feature on map and view in table.
Projection: A map projection is any method of representing the surface of a sphere or other three-dimensional body on a plane. Map projections are necessary for creating maps. All map projections distort the surface in some fashion. (Wikipedia.org) Shape, Area, Length
Raster: Geo-tiffs Esri grids (workstation or in geodatabases) Imagine (.img) Grass DEM (digital elevation model) Satellite data Spatial Data Formats
Vector (topological) vs CAD based line work • ArcGIS (esri) formats: • Coverages • Shape files • File geodatabases • Personal geodatabases • SDE geodatabases • KML (Google) Keyhole Markup Language • AutoCad drawing files (DWG) • Digital Line Graphs (DLG) • Spatial Data Transfer System (SDTS) • Topologically Integrated Geographic Encoding and Referencing Files (TIGER): Census data • Point clouds: (from LiDAR data) Spatial Data Formats Cont.
KML: KMZ (compressed) E00: ESRI coverage and grid exchange format Zip: many times you find shape files zipped up .mxd: file created when you make a map document in arcmap .msd: file created from .mxd to optimize for a server Layer files: saves symbology on a layer Exchange Formats/other extensions
ArcGIS is client side software: create and manage data, create maps, figures. ArcServer is server side (used to develop map and image services) ARCGIS API’s (used to develop web based applications with map and image services) ESRI GIS Software
Personal geodatabase: worked with Access, is being deprecated. File geodatabase: similar to personal, but without the limitations of personal geodatabase, intended for use by one person at a time: (will get file locks between programs) SDE Geodatabase: used with relational database such as Oracle, SQL Server. Intended for versioning and multiple users. Older types: coverage and shape file: (file geodatabase to take place of shape file). ArcGIS data types
ArcGIS: 3 main modules: • ArcCatalog: manage files, metadata, preview, search • ArcMap: make maps, do analysis, editing • ArcToolbox: create models, manipulate your data, automate processes • Minor modules: • ArcGlobe: view data in 3D on a globe • Workstation (command line) • ArcScene: 3D data but not in global projection ArcGIS Desktop Modules
Importing/exporting Finding Existing Data to Meet your Research Goals Connecting to external database tables Map server technologies Using ArcGIS on-line Storage/access File naming conventions Publishing/archiving external source datasets Study Site Locations Special consideration for archiving and publishing spatial datasets
May need to import or export files (.e00) Older structure used complicated file structure. Don’t use windows explorer to copy/move data: use ArcCatalog. Make sure that the projection is defined, and try and get your data into the same projection. (projection tools in arctoolbox under data management) Import/Export
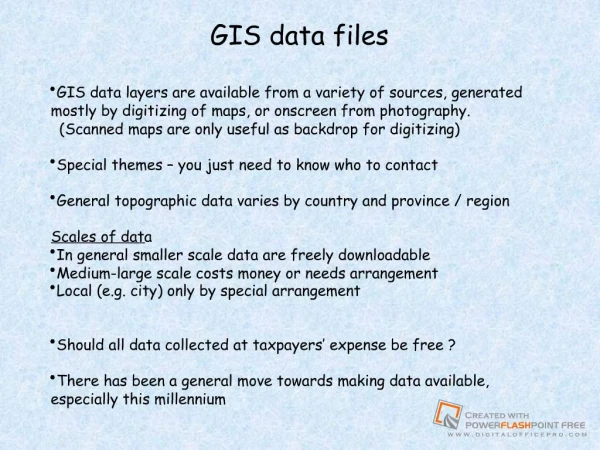
Federal Agencies State clearinghouses Local governments/universities LTER websites NGO’s Searches by topic on Google, Yahoo, etc Evaluate quality, suitability of data. Is it recent, documented, have projection information, appropriate scale and extent? Finding Existing Data to Meet your Research Goals
MYSQL does not play nice with ArcGIS 10.0 Formatting of data columns can be difficult (ArcGIS often changes numeric to text) Spatial join doesn’t work in some versions of ArcGIS 10 Software puts locks on files (shapefiles) Connecting to external database tables
Internet access to data, as you symbolized. Users can download (option) You can link to the server source in your EML Mashup with other data sources (lots of services available on-line for free) Good API tools to use within a website Map Services
Tools available to share data/applications. • Some limitations size/editing/access • Lots of on-line help and decent search. • Sometimes it’s better to search on Google. • http://www.arcgis.com/home/ • You need to sign in, but it’s free. ArcGIS On-line
Format is KML or KMZ Type in location: Duck Pond, ABQ Add your own data Google Maps API: imbed map in your website https://developers.google.com/maps/ LTERMapS: http://www.lternet.edu/map/index.php Google Maps/Globe
Organization on Network vs. what’s available on-line ESRI has some searching tools (works if you use their metadata) Raster data requires much more storage LiDAR data (point clouds) are huge (Terabytes) Image libraries can help Find web services on-line, then you don’t have to copy data to your site. Create a common directory for large datasets, where people can access, but not modify Clean out your interim data. You will generate a lot of it and document your data as you create it. Storage/Access
No blanks between words • Yes: boundary_hja.shp • No: boundary hja.shp • Keep your file names short (too long and they truncate). You can put long title in metadata • Keep your attribute titles short, as they tend to truncate as well, especially when you make several overlays or join data from another table File naming conventions
Data is obtained from a GIS provider: • Clearinghouse, private company, etc. • When? • Extent of data has changed • Area of interest clipped from state-wide layer • Critical to research • Time sensitive (Census, land-ownership) • Include source metadata if available. Publishing/archiving external source datasets?
Lat/long in decimal degrees to the 6th decimal place Single point locations • Lat/long create file, kml, or store in EML File of point locations • Create event view in GIS, convert to a GIS file or KML • Make sure that you store data in numeric fields, not text fields • Don’t use MySQL if working with esri products. Use highest quality of GPS unit to collect data Correctable if possible and correct to closest base station Best to record lat/long in NAD 83 or WGS 84 Datums Study Site Locations
Geo-spatial Metadata Formats ESRI metadata editor Automating Processes Editing metadata help Editing for EML Exporting to FGDC Format FGDC to EML Stylesheet Process EML into a repository Documenting Spatial Data
Documenting GIS data power point • http://im.lternet.edu/node/968 • Best Practices for documenting geospatial data version 2 • http://im.lternet.edu/project/GIS_document • Esri2EML stylesheet • http://im.lternet.edu/project/Esri2Eml Specific Help
Polygons, lines: • Store in GIS layer and add to EML as related file • Can convert simple polygons/lines in KML • Geographic Context: • Bounding boxes (min/max x and y) • For points, your min/max x and min/max y can be the same. • Capture information about your study site, Study Site Locations
File with lat/long or xy coordinates • Check format (needs to be numeric) • Create a shapefile or geodatabase • ArcMap: • Bring table/spreadsheet into ArcMap • Right click: display xy data (input geographic reference) • Export into shapefile or geodatabase • Data>export data (select shapefile or geodatabase) • ArcToolbox: • Data Management Tools>Layers and Table Views>make xy event layer Creating GIS layer out of XY coordinate file:
1. From Google: http://code.google.com/apis/kml/faq.html • 2. Other tools: • http://batchgeo.com/ (puts your spreadsheet into Google maps) • shp2kml 2.0: Shape-file to Google Earthhttp://www.zonums.com/shp2kml.html • ArcToolbox: conversion tools>From KML and To KML Creating a KML file
Google Search Google Maps/Google Earth ArcGIS (brief) ArcMap (bringing in spreadsheet) XML File section for geographic coverage Demo
Find coordinate data for all your study sites. You should have marked these areas on the exercise map when you were in the field. • From a web browser, go to Googlemaps.com • Search on “Duck Pond, ABQ” • Zoom into the Duck Pond, • Right click over your study site, and click: “what’s here”. Hover over/click the marker and you will see the coordinates: (negative number is the longitude, positive is the latitude) copy and paste into your spreadsheet/document. • Longitude will be the Easting/Westing Coordinates, and Latitude will be the Northing/Southing • Create map of study area using Google Maps or ArcGIS*. • Create map after logging into google. • My places: Create Map (interactive tutorial) • Right click: “Add a place marker” (title, description) • Right click on spot, “what’s here” to get lat/long. (hover over marker) • Draw a line/shape • Save/print: (not sure how to get image instead of base map) • * Create GIS data out of xy coordinates: add spreadsheet to arcmap, and create a point layer out of the points • Extra Credit: • Export data to KML/Google • Add Lat/Lon data to EML file: • Add at Dataset Level (largest extent of all your points) • Add in methods: for points, you have the same value for n/s and e/w Exercise
geographicCoverage General Information: The <geographicCoverage> element is used to describe geographic locations of research sites and areas related to the dataset. It is recommended to use the element at different levels for different types of information. Clearly there are many ways this element can be used and this document recommends one approach to make EML within LTER more consistent and easier to use in applications like the LTERMapS. At the dataset level (eml:eml/dataset/coverage) one <geographicCoverage> element should be included, whose <boundingCoordinates> describe the extent of the data. As a default, the bounding box could describe the entire LTER site as stored in SiteDB. However, it is strongly recommended that a more accurate extent of observations be provided, i.e., the maximum extent of the data, for each of east, west, north and south. Additional <geographicCoverage> elements may be entered at the dataset level if there are significant distances between study sites and it would be confusing if they were grouped into one bounding box. For example, cross-site studies where a bounding box would represent North American or more should have two bounding boxes, one for each site. Example: geographicCoverage at the dataset level <coverage> <geographicCoverage> <geographicDescription>Ficity, FI metropolitan area, USA</geographicDescription> <boundingCoordinates> <westBoundingCoordinate>-112.373614</westBoundingCoordinate> <eastBoundingCoordinate>-111.612936</eastBoundingCoordinate> <northBoundingCoordinate>33.708829</northBoundingCoordinate> <southBoundingCoordinate>33.298975</southBoundingCoordinate> <boundingAltitudes> <altitudeMinimum>300</altitudeMinimum> <altitudeMaximum>600</altitudeMaximum> <altitudeUnits>meter</altitudeUnits> </boundingAltitudes> </boundingCoordinates> </geographicCoverage> </coverage> Geographic Coverage at the Dataset Level for EML
From EML Best Practices: Spatial Sample Units in Methods If sampling took place in discrete point locations, those sites should appear at eml:eml/dataset/methods/sampling/spatialSamplingUnits/coverage. A list of individual sampling sites should be entered under <spatialSamplingUnits>, each site in a separate coverage element. More information about sampling sites can be found under <methods>, Example: geographicCoverage for single sampling point locations <spatialSamplingUnits> <coverage> <geographicDescription>sitenumber 1</geographicDescription> <boundingCoordinates> <westBoundingCoordinate>-112.2</westBoundingCoordinate> <eastBoundingCoordinate>-112.2</eastBoundingCoordinate> <northBoundingCoordinate>33.5</northBoundingCoordinate> <southBoundingCoordinate>33.5</southBoundingCoordinate> </boundingCoordinates> </coverage> <coverage> <geographicDescription>sitenumber 2</geographicDescription> <boundingCoordinates> <westBoundingCoordinate>-111.7</westBoundingCoordinate> <eastBoundingCoordinate>-111.7</eastBoundingCoordinate> <northBoundingCoordinate>33.6</northBoundingCoordinate> <southBoundingCoordinate>33.6</southBoundingCoordinate> </boundingCoordinates> </coverage> <coverage> <geographicDescription>sitenumber 3</geographicDescription> <boundingCoordinates> <westBoundingCoordinate>-112.1</westBoundingCoordinate> <eastBoundingCoordinate>-112.1</eastBoundingCoordinate> <northBoundingCoordinate>33.7</northBoundingCoordinate> <southBoundingCoordinate>33.7</southBoundingCoordinate> </boundingCoordinates> </coverage> </spatialSamplingUnits> Latitudes and longitudes should be in the same commonly used datum (i.e., all values in WGS84 or NAD83) and expressed to at least six decimal places (the EML2.1 schema enforces decimal content). International convention dictates that longitudes east of the prime meridian and latitudes north of the equator be prefixed with a plus sign (+), or by the absence of a minus sign (-), and that west longitudes and south latitudes be prefixed with minus sign (-). See Example above. See the EML specification for more information and other examples. <geographicDescription> The description is a string. It should be comprehensive and include the country, state, county or province, city, general topography, landmarks, rivers, and other relevant information. The method for determining <boundingCoordinates>,