Download
1 / 250
2.51k likes | 2.52k Views
The 8-D Methodology. Team Oriented Problem Solving TOPS A Philosophy and A Part Of Continuous Improvement. Files Included In This Package. These files are currently included with this release of the implementation package: 8-D_Pre-Gx.ppt is the main Powerpoint file.

E N D
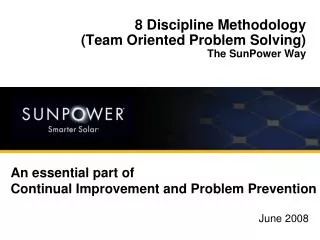
The 8-D Methodology Team Oriented Problem Solving TOPS APhilosophyandA Part OfContinuous Improvement
Files Included In This Package • These files are currently included with this release of the implementation package: • 8-D_Pre-Gx.ppt is the main Powerpoint file. • Updates are free for 1 year from purchase date. As the set of files in this tome increases, the price may increase. Buy now to avoid!
The Red Road Graphics • Files with the extension .swf are Macromedia Flash files (http://macromedia.com). They are Courtesy of The Red Road (http://www.sci.fi/~leo/). I have included them as I am a graphics ‘nut’ and I really believe they help a lot of text challenged people, myself included, understand several basic concepts. • I develop on a Macintosh using Office 98. Work is checked for compatibility on a Compaq PC running Windows 98 and Office 2000. The free download version of Quicktime(http://www.apple.com/quicktime/) plays .swf files on both my Compaq peecee and on my Macintosh. The latest version of Quicktime is a ‘beta’ release of version 5 in which Flash is incorporated. • Both computers have Shockwave and the Flash player installed, as well as the latest Quicktime. All are free downloads. There is a Quicktime Pro edition for sale, but you only need the free downloadable version. • On the Macintosh platform, the files ‘play’ in Powerpoint like movies when in the SlideShow mode. On the PeeCee platform they do not. The Macintosh version of Powerpoint handles .swf files as ‘movies’ while the PeeCee does not appear to.
About .swf Files - 1 • If you have the Shockwave Flash plug-in for Internet Explorer installed, you can see these files online at: http://16949.com/pdf_files/. All the .swf files are there (look by name). Using Explorer on both my PeeCee and my Mac, clicking on the file in my browser opens and allows you to ‘play’ the file. I don’t have Netscape for the PeeCee so I can’t check that, but on my Mac I cannot get the Netscape browser to play the file even though the plug-in is installed - so I doubt it will play with Netscape on the PeeCee. • NOTE: Microsoft’s Photo Editor does not ‘play well’ with animated gif files. It is not animated gif ‘aware’. You can see the first frame, but that’s it.
About .swf Files - 2 • To Play Animations From Within Powerpoint on a PeeCee • Except for the Histogram animation, I have included a .gif file as a counterpart to each .swf file. Any program which will play animated gif files will play these files. You can make the animations play in SlideShow mode in Powerpoint by first setting up the file links. Go to each presentation slide which contains an animation and delete the animation. Then, go to the Insert / Picture / From File… menu cascade. Releasing the mouse on the From File… menu line item will bring up a file browser. Browse to and click on the appropriate .gif file for that slide. The animation will now play (continuous looping) in the SlideShow Mode. • The controls on the files only work if you are viewing the Flash files!!! The controls on the gif files do NOT work!!! • The location of .mov (Quicktime movie) and .ani (Windows animation/movie) versions of these .swf files: http://www.16949.com/pdf_files/Red_Road_Graphics/
Origins: Mil-Std 1520 • The origins of the 8-D system actually goes back many years. • The US Government first ‘standardized’ the system in Mil-Std-1520 “Corrective Action and Disposition System for Nonconforming Material” • Mil-Std-1520 - First released: 1974 • Last Revision was C of 1986 • Canceled in 1995
The Target & Goal Continuous Improvement and Prevent Recurrence Production Pre-Launch Prototype USL LSL
The 8-D System Awareness of Problem 4. 5. Choose/Verify Corrective Actions Identify Potential Cause(s) Use Team Approach Implement Permanent Corrective Actions Select Likely Causes 1. 6. Is the Potential Cause a Root Cause? Describe the Problem 2. Prevent Recurrence 7. No Yes Implement and Verify Interim (Containment) Action(s) Congratulate Your Team 8. 3. Identify Possible Solutions
Typical Investigation Time Line Initiate Containment Actions Withdraw Containment Actions Problem Solving Efforts D1 Symptom Appears Internal and/or External Establish Team D4 Second Assessment Internal Group Verify Permanent Corrective Actions Investigation D3 D6 D5 D7 D0 D2 Implement Permanent Corrective Actions Third Assessment Internal Group with Internal / External Customer Involvement First Assessment Internal Individual This process can stop or loop back upon its self at any point in the process.
A Nonconformance Database This nonconformance database was written for an automotive manufacturer as is rather evident by the documentation addressed (circled in red). For other companies, it is a matter of looking at your documentation and system(s) and aligning appropriate documents.
Analysis vs. Action The ‘disciplines’ which make up the 8-D process are divided into Analysis and Action steps. Analysis Steps • D2 Problem Description Analysis - A method to organize information about the Symptom into a Problem Description through the use of repeated WHYs. • D4 Root Cause Analysis - A process to arrive at Root cause paths. Action Steps • D3 Containment - An interim Verified action that will prevent the Symptom from reaching the customer. • D5 Choose Corrective Action - The best corrective action which, when implemented in D6, permanently eliminates the Root Cause of the problem. • D6 Implement Corrective Action - The best corrective action from D5 that is introduced into the process and Validated over time. • D7 System Preventive Action - Actions which address the system that allowed the problem to occur.
Process Tools Past Present Future Problem Solving / Analysis Decision Making / Concerns Analysis Planning and Problem Prevention D0 D1 Use Team Approach Describe The Problem D2 D3 Containment (Interim) Actions Root Cause Analysis D4 Implement Permanent Corrective Action Choose/Verify Corrective Action(s) D5 D6 Prevent Recurrence Action D7 Congratulate the Team D8
Process Tools • Problem Solving A systematic process which describes, analyzes and identifies Root Causes of a problem. It is used to solve ‘past’ actions that are now causing unwanted effects. Generally it takes more time, energy and resources to correct a problem than to prevent it. This tool is used in D2 and D4 for describing a problem and finding its Root Cause. • Decision Making A process used to select the best of various options. It addresses ‘present’ situations where the correct decision needs to be made the first time in order to implement appropriate actions. The tool is used at steps D3 and D5 for determining which interim and permanent corrective actions to implement. • Planning and Problem Prevention A process which ‘looks into the future’ to anticipate what might go wrong with a plan. The process requires team members to develop plans to prevent problems from happening or causing serious damage if they do happen. Generally, Planning and Problem Prevention provides the most cost effective way of avoiding problems. This tool is used in D6 and D7 for implementing permanent corrective actions and preventing recurrence. • Concerns Analysis A process which breaks down complex issues into manageable concerns, prioritizes them and assigns the proper process tools. Like Decision Making, it deals with ‘present’ situations and helps to step back from a long list of ‘To Do’ activities and assess the situation from a broader perspective. Most often used at D0 and D1 by management to help assemble a team, define its goals and objectives.
Basic Business Advanced Business Recommended Statistical Courses Office, Staff, & Management Selected Staff, & Management Statistical Process Control Measurement System Analysis Design of Experiment Production Floor, Production Staff & Management, All of Quality & Engineering Production Staff & Management, All of Quality & Engineering Specific Production Staff, Quality Engineers& QA Manager & Product Engineering
Statistical Tools 1 Statistical Process Control 1. Cause and Effects Diagram 2. Operational DefinitionsLay Engineering Specs 3. Data Collection/Log/Check Sheet 4. Pareto Diagram 5. Histogram Dot Plot Stem and Leaf Plot Box and Whisker Plot 6. Control Chart X-bar R Chart X-bar and s Chart Median and R Chart p Chart c Chart u Chart np Chart Run Chart (chart of individuals) 7. Scatter Diagram Pie Chart Bar Chart Stacked Bar Chart Pictorial Graph Trend Chart Time-line Chart Process Flow Chart Ongoing Control - Monitoring Statistical Process Control Charts Quality Performance Indicators Histograms Check Sheets Log Sheets
Statistical Tools 2 Quality Performance Indicators Verification, Prevention and Investigation Plant Trend Charts Warranty Charts Engineering Specification Testing Fleet Testing Test Track Burn-In Results Process Capability/Potential Studies Statistical Process Control Charts Quality Performance Indicators Histograms Check Sheets Log Sheets Design Of Experiments Regression Analysis Process Flow Chart Taguchi (screening) Analysis Contingency and Forecasting Failure Modes and Effects Analysis Design of Experiments Regression Analysis Reliability Studies
Universe, Populations & Samples Universe: The collection of all elements. Population: The set of objects of interest. Sample: A subset of objects taken from the population. Randam Sample: All possible samples of the same size have an equal chance of occuring.
Histogram Animation Play Histogram SWF File Courtesy of The Red Road http://www.sci.fi/~leo/
2.01 1.59 1.73 1.87 1.66 1.94 Normal Distribution (Bell Curve) This is a pattern which repeats itself endlessly not only with pieces of pie but in manufactured products and in nature. There is always an inherent Variability. Sometimes it’s a matter of finding a measurement device sensitive enough to measure it. Measurements may be in volts, millimeters, amperes, hours, minutes, inches or one of many other units of measure. It you take a sample of a population (such as height) and you chart their distribution, you will end up with a curve that looks like a bell. A Distribution which looks like a bell is a Normal Distribution. Normal Distributions are the most common type of distribution found in nature - but they are not the ONLY type of distribution. Heights of men in the military: Average height: 1.80 meters Shortest: 1.59 meters Tallest 2.01 meters Sixty-eight percent are between 1.73 and 1.87 meters. Ninety-five per cent are between 1.66 and 1.94 meters.
X = X-Bar = Average Mean Basic Terms s= sigma = Standard Deviation If we measure 1 Standard Deviation on each side of the center of the curve , 68% of the Area will be between the lines drawn through these points. The Human Proportions table tells us the Standard Deviation (s - dispersion) of men’s heights is 0.07 meters, so by simple addition and subtraction we know that 68% of the men are between 1.73 and 1.87 meters. This is X-Bar. It tells us the Average of a group of numbers (in this case average height). X-Bar is the middle of the curve where we have the largest percentage of men. sis the Greek letter Sigma. It is the distance from the center of the curve to the point where the curve stops curving downward and starts curving outward. We’re interested in points at 1, 2 and 3 Standard Deviations from the Mean (the center). 1.8 + 0.07 = 1.87 1.8 - 0.07 = 1.73
X = X-Bar = Mean Standard Deviation The most common measure of dispersion. The standard deviation is the square root of the variance, which is the sum of squared distances between each datum and the mean, divided by the sample size minus one. For a tiny sample of three values (1,2,15), the mean is: (1 + 2 + 15)/3 = 6 and the variance is ((1 - 6)^2 + (2 - 6)^2 + (15 - 6)^2) / (3 - 1) = 61 The standard deviation (s) is not a very helpful measure of spread for distributions in general. Its usefulness is due to its intimate connection with a special type of distribution, namely to the normal distribution. The standard deviation is more sensitive to a few extreme observations than is the mean. A skewed distribution with a few values in the 'long tail' will have large standard deviation and it will not provide much helpful information in such cases. Mean s= 0.070 s= sigma = Standard Deviation Mean s= 0.80 Finding the Standard Deviation
Cp Animation Play Cp SWF File Courtesy of The Red Road http://www.sci.fi/~leo/
Cpk Animation Play Cpk SWF File Courtesy of The Red Road http://www.sci.fi/~leo/
D0Problem Identified Houston! We’ve Got A Problem!
Where Was The Problem Identified? Supplier Here? In Transit Or Here? Or Here? Or Here? Company Receiving / Inventory Inventory / Shipping In-Process In Transit Or Here? Or Here? Or Here? Customer Or Here?
Typical Top Level Operations Flowchart Support Processes Management Processes Results / Forecasts Business Plan Mgmnt Mtgs. Quality Systems Internal Audits Procedures & Standards Document Control Training Facilities Processes Material Stocking Control of Test Equipment Personnel Processes Corrective Action Financial Processes Design Engineering Supplier Approval Data Security Customer Complaints Customer Services Preventative Maintenance Account Management Sales / Marketing Order Receipt Order to MFG. Procure Material Build Product Ship Product Bill Customer Collect Money • Mail Invoice • Order Review • Gen. Doc. • Acknowl. Order • Notify Mfg. • Verify Inputs • Plan the Job • Release for Purch 7 • Mfg. • Review Doc. Pack. • Kit Materials • Set up Equip. • Mfg. per Route Card • Package • Send to Finish goods • Confirm Date • Create Pack. Docs. • Create / Dist Invoice • Sched. Carrier • Generate Ship. Docs. • Pass to shipper • File Paperwork • Receive Payments • Resolve Disputes • Mrkting Process • Sales Process • Quote Process • Credit Approval • Review Reqmts • Make vs. Buy • Select Supplier • Issue RFQ • Place Orders • Eval. Incoming Matls • Material Dispo. • Autorize Supp. pay
Process Flow Animation Play Process SWF File Courtesy of The Red Road http://www.sci.fi/~leo/
Early Process Flow Diagram • Inspection Points • Inspection Frequency • Instrument • Measurement Scale • Sample Preparation • Inspection/Test Method • Inspector • Method of Analysis
Where Was The Problem Discovered? Manufacturing Entity Internal or External Customer ‘Receiving’ ‘Pack & Ship’ Machine or Cell 2 Machine or Cell 3 Machine or Cell 1 ‘Segmented = By machine or ‘cell’ ‘Receiving’ ‘Pack & Ship’ Device,Technology or Family = a flow of a ‘technology’ or ‘device’
Where Did The Problem Escape? Manufacturing Entity ‘Receiving’ ‘Pack & Ship’ Machine or Cell 2 Machine or Cell 3 Machine or Cell 1 Are There Multiple Escape Points? What Is The Escape Root Cause?
Ctrl Plan & FMEA Ctrl Plan & FMEA Ctrl Plan & FMEA White Space Issues Final Pack Ship Receiving Assembly MOD 2 MOD 1 Control Plan & FMEA Control Plan & FMEA Responsibility = MOD Responsibility = ASSY Responsibility = MOD Responsibility = Materials? SQA? White Space Issue Warehouse Customer
Asking Why. How Far? Where Do I Look? General Management Practices Process Flow Diagram FMEA Control Issues Control Plan Materials Planning Design Rules M&TE Needs Materials Practices Manufacturing Planning Training Needs Manufacturing Practices Training Practices
Design Block Diagram Example If the product function is complex, break it down into smaller sub-systems. Identify Primary vs. Secondary functions. System Body Doors Window Sub-System Interior Exterior Door Inner Panel Sealing with Strip Latch / Lock Component Glass
Cause and Effects Animation Play Cause and Effects SWF File Courtesy of The Red Road http://www.sci.fi/~leo/
Material Inspector Methods Test Method Sample Collection Training Workmanship Sample Preparation Parallax Practice Samples Reproducibility Ergonomics Standards Measurement Discrimination Vibration Bias Temperature Repeatability Lighting Calibration These are some of the variables in a measurement system. What others can you think of? Linearity Humidity Instrument Environment Failure Modes In Measurement Systems • Linearity • Accuracy • Repeatability • Reproducibility • Correlation for duplicate gages • Gages may be needed prior to gage sign-off at subcontractor plant or any in-house pilot runs
Process Variation • Distinguishing between the types of causes iscriticalbecause the appropriate managerial actions are quite different for each. Without this distinction, management will never be able to tell real improvement from mere adjustment of the process or tampering. • In practice, the most important difference to grasp first is the difference between special cause variation and common cause variation. • The strategy for special causes is simple: Get timely data. Investigate immediately when the data signals a special cause is/was present. Find out what was different or special about that point. Seek to prevent bad causes from recurring. Seek to keep good causes happening. • The strategy for improving a common cause system is more subtle. In a common cause situation, all the data are relevant, not just the most recent or offending figure. If you have data each month for the past two years, you will need to look at all of that data.
Distributions From Variation Sometimes you can look at two slices of pie and tell which is bigger. Sometimes you cannot. Home Experiment: Slice a pie up into what you think are equal sized pieces and line them up according to size. Many look the same. If we want to arrange the pieces according to size, we need another way to tell how big each piece is. A weight scale will do quite well. Now - lets look at what we would find if we weighed each piece. There are big and little pieces, but you can see that the number of pieces in each step of the graph (weight group) varies from the largest piece to the smallest piece in a fairly regular and symmetrical pattern. This is the Distribution of the weights. The curve is what we would expect if the Distribution was a ‘Normal’ distribution. Imagine doing this with 100 pies!
Process Variation • All variation is caused. There are specific reasons why your weight fluctuates every day, why sales go up, and why Maria performs better than Robert. Management must recognize that variations in production or quality within manufacturing or service processes can be viewed as "special cause" variations, which are best removed by team members operating the process and "common cause" variations, which require management action to change some inherent feature of the process. There are four main types of causes. • Common causes are the myriad of ever-present factors (e.g., process inputs or conditions) that contribute in varying degrees to relatively small, apparently random shifts in outcomes day after day, week after week, month after month. The collective effect of all common causes is often referred to as system variation because it defines the amount of variation inherent in the system. • Special causes are factors that sporadically induce variation over and above that inherent in the system. Frequently, special cause variation appears as an extreme point or some specific, identifiable pattern in data. Special causes are often referred to as assignable causes because the variation they produce can be tracked down and assigned to an identifiable source. (In contrast, it is usually difficult, if not impossible, to link common cause variation to any particular source.) Special Cause variation results from events which are occurring outside the process. For example, a relatively major change in temperature or humidity could cause significant variation (points outside control limits) in the process.
Causes of Variation Common Causes of Variation Common causes are problems inherent in the system itself. They are always present and effect the output of the process. Examples of common causes of variation are poor training, inappropriate production methods, and poor workstation design. Special (Assignable) Causes of Variation Special causes are problems that arise in a periodic fashion. They are somewhat unpredictable and can be dealt with at the machine or operator level. Examples of special causes are operator error, broken tools, and machine setting drift. This type of variation is not critical and only represents a small fraction of the variation found in a process. As we can see, common causes of variation are more critical on the manufacturing process than special causes. In fact Dr. Deming suggests that about 80 to 85% of all the problems encountered in production processes are caused by common causes, while only 15 to 20% are caused by special causes.
Facts About Causes of Variation Common Causes of Variation • Account for 85-95% of quality problems • Are due to the many small sources of variation "engineered" into the process of the "system”. • Are naturally caused and are always present in the process because they are linked to the system's base ability to perform; it is the predictable and stable inherent variability resulting from the process operating as it was designed. • Standard deviation, s, is used as a measure of the inherent process variability; it helps describe the well-known normal distribution curve. • Correctable only by management; typically requires the repair/replacement of a system's component, or the system itself. Special Causes of Variation • Accounts for 5-15% of quality problems. • Is due to a factor that has "slipped" into the process causing unstable or unpredictable variation. • Are unpredictable variations that are abnormal to the process including human error, equipment failure, defective/changed raw materials, acid spills, power failures, etc.; failure to remove them can result is corrosion, scale, metal fatigue, lower equipment efficiency, increased maintenance costs, unsafe working conditions, wasted chemicals, increased down-time (plant shut-down...), etc. • Removal of all special causes of variation yields a process that is in statistical control. • Correctable by local personnel.
Tampering - Process Variation • Tampering is additional variation caused by unnecessary adjustments made in an attempt to compensate for common cause variation. • Tampering with a process occurs when we respond to variation In the process (such as by “adjusting” the process) when the process has not shifted. In other words, it is when we treat variation due to common causes as variation due to special causes. This is also called “responding to a false alarm,” since a false alarm is when we think that the process has shifted when it really hasn’t. • In practice, tampering generally occurs when we attempt to control the process to limits that are within the natural control limits defined by common cause variation. We try to control the process to specifications, or goals. These limits are defined externally to the process, rather than being based on the statistics of the process.
Structural Variation • Structural Variation is regular, systematic changes in output. Typical examples include seasonal patterns and long-term trends.
Problem vs. Symptom • At this point it is important to distinguish between a problem and a symptom.A symptom, for example, could be a split in a seam. • Generally, there are a series of problems associated with a process that causes a symptom (in this case the seam split). A symptom often illustrates a ‘gap’ between the desired quality (of the seam) and its actual quality. The seam split because of a problem in the process or in the design. • Every company has its own internal system for appraising symptoms and problems. Sometimes a symptom occurs where 1 person can evaluate the problem and address it. Other times the symptom is significant and requires a team to investigate and remove the cause.
When An 8-D Is Necessary • Using ‘Good Judgment’ is the first step in deciding when to start an 8-D. • Often, however, an 8-D is a customer requirement in response to a problem: Feedback from the customer that there is a concern with the product. Sometimes the concern shows up as a Symptom that has been detected by the customer. • Ideally, a measurable will indicate when an 8-D should be started. When an undesirable trend in a process develops, corrective action can be taken to reduce the cause of the variation before a symptom occurs in the process and escapes to the customer. • If the undesirable trend triggers questions, a decision must be made whether the symptom can be fixed by an individual or whether the symptom requires further analysis. Further analysis typically indicates it’s time to assemble an 8-D problem solving team.