Download
1 / 1
10 likes | 130 Views
RT-PCR Gene Profile of ER β. 140. 120. 100. 80. 60. mRNA/B-actin mRNA (%). 40. 20. 0. Control (No. E2 (5 uM). 4-NP (5 uM). Treatment). Treatments. Methodology. U937 Human Immune Cells. Control (No treatment) (n=4). Estrogen (5 uM) (n=4). 4-nonylphenol (5 uM) (n=4).

E N D
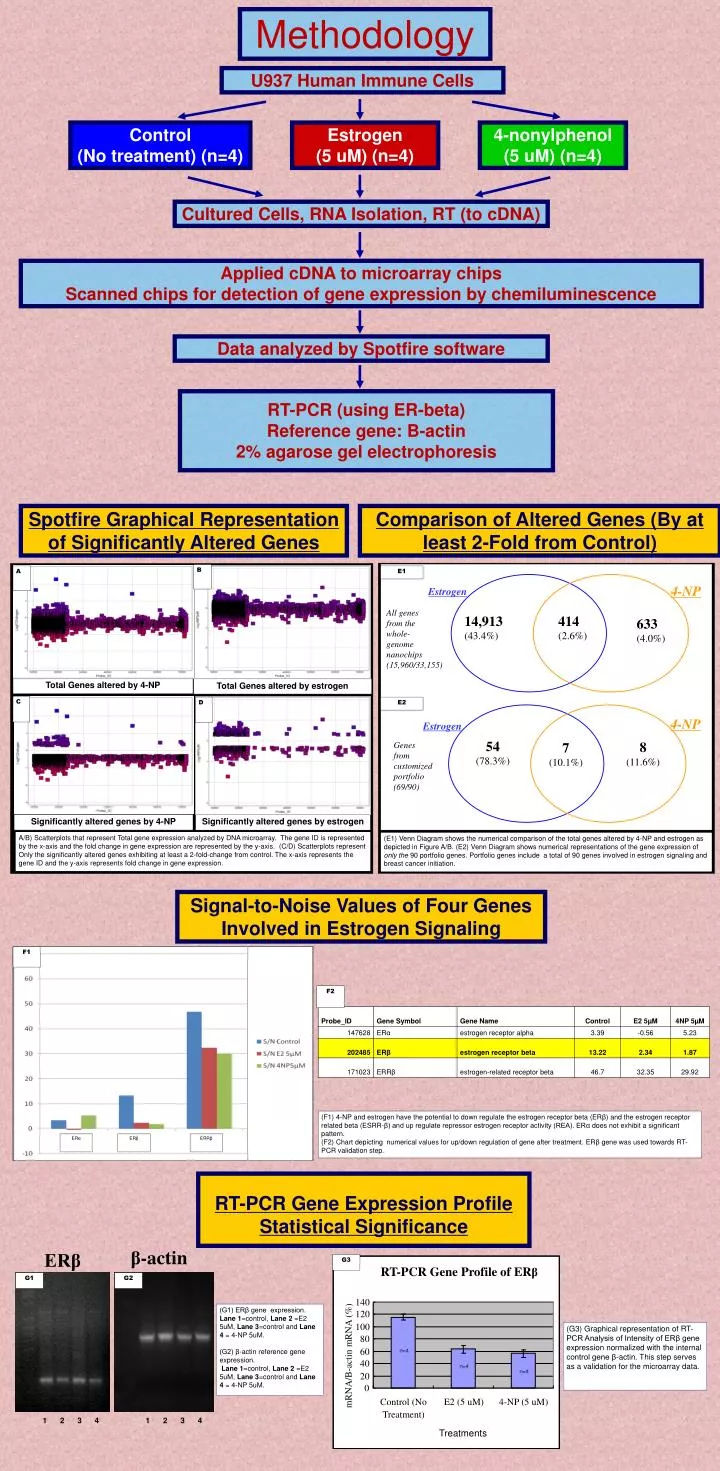
RT-PCR Gene Profile of ERβ 140 120 100 80 60 mRNA/B-actin mRNA (%) 40 20 0 Control (No E2 (5 uM) 4-NP (5 uM) Treatment) Treatments Methodology U937 Human Immune Cells Control (No treatment) (n=4) Estrogen (5 uM) (n=4) 4-nonylphenol (5 uM) (n=4) Cultured Cells, RNA Isolation, RT (to cDNA) Applied cDNA to microarray chips Scanned chips for detection of gene expression by chemiluminescence Data analyzed by Spotfire software RT-PCR (using ER-beta) Reference gene: B-actin 2% agarose gel electrophoresis Spotfire Graphical Representation of Significantly Altered Genes Comparison of Altered Genes (By at least 2-Fold from Control) 4-NP Estrogen B A E1 14,913 (43.4%) 414 (2.6%) 633 (4.0%) All genes from the whole- genome nanochips (15,960/33,155) Total Genes altered by 4-NP Total Genes altered by estrogen 4-NP C D Estrogen D E2 54 (78.3%) 8 (11.6%) 7 (10.1%) Genes from customized portfolio (69/90) Significantly altered genes by 4-NP Significantly altered genes by estrogen A/B) Scatterplots that represent Total gene expression analyzed by DNA microarray. The gene ID is represented by the x-axis and the fold change in gene expression are represented by the y-axis. (C/D) Scatterplots represent Only the significantly altered genes exhibiting at least a 2-fold-change from control. The x-axis represents the gene ID and the y-axis represents fold change in gene expression. (E1) Venn Diagram shows the numerical comparison of the total genes altered by 4-NP and estrogen as depicted in Figure A/B. (E2) Venn Diagram shows numerical representations of the gene expression of only the 90 portfolio genes. Portfolio genes include a total of 90 genes involved in estrogen signaling and breast cancer initiation. Signal-to-Noise Values of Four Genes Involved in Estrogen Signaling F1 F2 ERα ERβ ERRβ (F1) 4-NP and estrogen have the potential to down regulate the estrogen receptor beta (ERβ) and the estrogen receptor related beta (ESRR-β) and up regulate repressor estrogen receptor activity (REA). ERα does not exhibit a significant pattern. (F2) Chart depicting numerical values for up/down regulation of gene after treatment. ERβ gene was used towards RT-PCR validation step. RT-PCR Gene Expression Profile Statistical Significance β-actin ERβ G3 G1 G2 (G1) ERβ gene expression. Lane 1=control, Lane 2 =E2 5uM, Lane 3=control and Lane 4 = 4-NP 5uM. (G2) β-actin reference gene expression. Lane 1=control, Lane 2 =E2 5uM, Lane 3=control and Lane 4 = 4-NP 5uM. (G3) Graphical representation of RT-PCR Analysis of Intensity of ERβ gene expression normalized with the internal control gene β-actin. This step serves as a validation for the microarray data. n=4 n=4 n=4 1 2 3 4 1 2 3 4