Download

1 / 27
280 likes | 434 Views
Data Handling. C IEA Insight is a key support for CIEA members. Through Insight you can tap into a range of materials in one place that can: help you develop your own knowledge and skills in specific areas of assessment help you develop your team’s knowledge and skills

E N D
Data Handling • CIEA Insight is a key support for CIEA members. • Through Insight you can tap into a range of materials in one place that can: • help you develop your own knowledge and skills in specific areas of assessment • help you develop your team’s knowledge and skills • give you access to information that you we hope you will find stimulating and informative.
Data Handling • Being able to organise sets of data in different ways is an important skill – it can lead to very powerful information • Deciding what, why and how to sort data in particular ways is really the trick here – the scenario that follows demonstrates the power in sorting the same data for different purposes and audiences
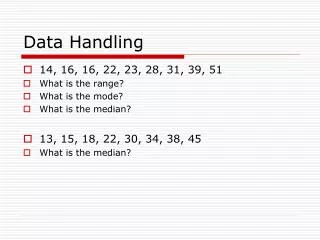
Here are some GCSE Results for North West England from 2003 Manipulating Statistics
When statistics are presented in this way it is very difficult to see any patterns that might be contained within the data. In order to make better sense of what the data might be saying you need to do two things: Select only the data that you want 2 Sort the data in a way that suits your purpose Manipulating Statistics
Select only the data that you want Let’s look at certain data from only 2 Local Authorities – Bury and Trafford. If you extract the % of 5 A*-C grades achieved by all pupils in those 2 authorities you find the following: Manipulating Statistics
Some people would immediately begin to make assumptions about this. e.g. Trafford performed better than Bury by 9.5% (This is not unusual as a newspaper headline) However, the following table shows something else: Now Bury out performs Trafford (But the headline is perhaps less dramatic) Manipulating Statistics
Language If you are tasked with interpreting statistics then beware of turning objective information into subjective judgements. Using language such as: better much improved decidedly worse out performing is dangerous. Stick to the facts that are available. Manipulating Statistics
Suppose you now want to focus on the percentage of pupils who did not achieve a GCSE pass at all. You need to sort the data accordingly: Manipulating Statistics
No doubt you could write your own headlines here. What the statistics do not tell you however, are vital matters such as: Types of school (selective, 11 plus, state school etc) Numbers of pupils (it is much easier to get 95% of a small number of middle class pupils through exams than it is a large number of pupils from deprived areas) Beware of taking certain statistics at face value. Manipulating Statistics
Suppose you now want to look at exam results over time (and some people do) Here are the 2007 GCSE results for the same set of Local Authorities Manipulating Statistics
You could now choose to look at the change in results from 2003 to 2007 – let’s stick with Bury & Trafford for purposes of comparison. Here is a form of pivot table created from the 2003 and 2007 data. (Pivot tables are covered in the accompanying spreadsheet training presentation.) Manipulating Statistics
You should notice something different about the numbers in the 2 pivot tables. Each seems to be authoritative BUT: 1 Beware of quoting % point increases as though they are % increases – a jump from 1% to 2% is only a 1% point increase but is a relative increase of 100% (Thinks press headlines again.) 2 Beware of comparing % rates in general – unless you know the number of pupils taking GCSEs it is unwise to make direct comparisons between years Manipulating Statistics
For example, DCSF figures show that in 2004/2005 total number of pupils at the end of Key Stage 4 was 633,414 2006/2007 this number was 649,159 In other words there were 15,745 more pupils at this stage in the 2005 GCSE cohort than in the 2007 GCSE cohort. Is it wise to simply compare percentage pass rates when the percentages are not derived from the same base numbers? Manipulating Statistics
Consider what the 2003 and 2007 results might be telling you if: The numbers of pupils in Bury had risen in the 4 intervening years The numbers in Trafford had fallen etc Manipulating Statistics
Choosing what, why and how to display. Now take the Manchester example again; Notice how 11.5 % of all pupils achieving no GCSE pass sounds worse than an 88.5% pass rate Similarly for 2007, a 95% pass rate sounds better than 5% without any pass. Without any manipulation of the raw data different messages can be created simply by what you choose to display and how you choose to do it. Manipulating Statistics
The Titanic sank on the 14th of April 1912. The ship was carrying 2,227 passengers and crew – 705 were saved. Either: After a terrible collision with an iceberg somehow over 30% of those on board were saved. A miracle! or The callous disregard for life shown by the White Star Company led to the loss of nearly 70% of all those on board the Titanic. Take your pick – but the same numbers. Manipulating Statistics
You can of course make statistics say whatever you want them to say. Take the following results of an American study: Children with larger feet spell better A great newspaper headline of the kind we see every day. Now think about it. Children with big feet are probably older than those with small feet Being older means that a child is more likely to be better at spelling The feet play no part in the actual spelling process at all! Manipulating Statistics
This kind of mistake is common. It involves the misunderstanding of a statistical link and causality Even though A happens at the same time as B – this is not in itself always proof that B is caused by A or vice versa. Manipulating Statistics
What you can do with data depends upon factors such as: What the data is How reliable the data is How well the data suits your purpose The CIEA framework and the various CIEA assessment compendia consider how data can be used in order to feed back to learners and other stakeholders. Data from an assessment should also be used to determine to what extent the assessment is fit for purpose. The use of assessment data
Supposing you obtained the following data from an assessment that you had helped to design: (The term facility refers to the percentage who obtained the correct answer – it is a measure of the level of difficulty of the question) What observations would you make about the assessment? The use of assessment data
Question 1 has a very low facility – over 60% of candidates answered this incorrectly – look again at the wording / design of the question and see if it can possibly provide better discrimination between weaker and stronger candidates. Question 2 has too high a facility – this will probably need to be replaced because it does not differentiate between weaker and stronger candidates. Question 3 has a good general facility but males scored significantly higher than females – on these grounds the question needs to be rewritten or replaced to avoid the bias. Question 4 is the only question which performed well – it has a good facility (between 55% & 75% is usually the optimum) The use of assessment data
The results of an assessment such as this should not be used for any real purposes whatsoever – only one question actually produced valid responses. How often do you (or does your centre) review its own assessments in this much detail? Feedback from an assessment is more than simply giving out marks to learners. The assessors need to consider the assessment data too. The use of assessment data
Good assessment data should allow: meaningful feedback to learners about their progress scope for suggested improvements that learners could make assessors to review the assessments Assessment data should not be used simply to link “facts” together in order to prove a personal thesis. If this year’s class performed better than last year’s class then that might be significant. It might just be that this year’s class contains better learners the teacher has become more comfortable teaching the class Blunt comparisons of small sets of results are usually pointless. The purpose of assessment data
Typical examples of the misuse of data include: …but the marks have risen by 100% in only one year Yes but last year the mark was 1 out of 1,000 and this year it is 2. Instead of congratulating yourselves on the astonishing 100% rise you should be asking why your assessment is producing such awful results. …girls are better than boys at GCSE There is some evidence that girls out perform boys in subjects with a large coursework element – equally boys tend to do better than girls if assessment is by means of a final exam only. The purpose of assessment data
If you have clear and objective assessment results then use them. Do not make claims that go beyond the data. For example Question 3 on the earlier slides does not prove that males are better than females in that subject. It probably shows that the question contains a degree of bias. Feedback should be useful to the learner and form part of a cycle of improvement. In some circumstances assessment will take place at the end of a course of study, otherwise assessment should be part of the course. The purpose of assessment data
The use of data is an important part of the teaching and learning process Be aware that data can be made to say all kinds of things. The CIEA hopes to be able to help you to develop your own abilities in this area. You can find out more about data handling in the members’ area of the CIEA website – www.ciea.org.uk The purpose of assessment data
The CIEA has made available; 1 a training slideshow on some of the uses of excel 2 sample data and tasks which accompany this Insight. If you are interested in increasing your skills in the area of data handling then work your way through these resources. There are then more detailed resources in the member area of the CIEA website. Data Handling Resources