Download
1 / 15
260 likes | 703 Views
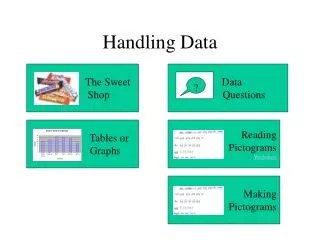
Handling Data. To solve a problem by organising, representing and interpreting data in tables, graphs and chart. By Amani El-Alawneh. Hello, MI3 M here. I hope you are all well and enjoying life! I have a problem that I would really, really like your help with.

E N D
Handling Data To solve a problem by organising, representing and interpreting data in tables, graphs and chart. By Amani El-Alawneh
Hello, MI3 M here. I hope you are all well and enjoying life! I have a problem that I would really, really like your help with. Here at my base we have two scientists in charge of representing our data. Their names are Agent A. Weed and Agent C. Weed (they are brother and sister).
They are in the middle of analysing some super sized data to use in our next top secret mission.Unfortunately, they have been called away on another top secret mission and have asked me to interpret the data!! My problem is that they left me data in a tally chart and it makes no sense to me! Please would you help me out? I zapped a copy of the tally chart and special instructions for representing the data. See you later……
Frequency means HOW MANY The table is called a frequency table This message will self destruct in 5 seconds
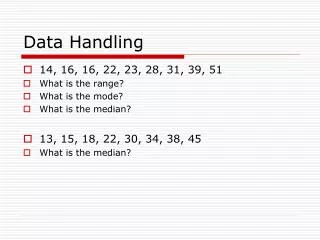
Mission One: Find the Frequency for each group by interpreting the tally marks. 16 14 23 4 2 13
Mission Two: Change the frequency table into a pictogram by using a symbol to represent 2 books.
Mission Two: Represents two books Change the frequency table into a pictogram by using a symbol to represent 2 books. Badgers Tigers Peacocks Elephants Pigs Spiders
Mission Three: Below shows representing 2 books. Use another number to represent . You need to choose the most suitable number. Badgers Tigers Peacocks Elephants Pigs Spiders
Mission Three: COMPLETED Represents Four books Badgers Tigers Peacocks Elephants Pigs Spiders
Hi All, M here again. Fantastic, you’ve completed all three missions. Secret Agent A. Weed and his sister C. Weed told me that I need to find a symbol that could represent 5 books. I can’t imagine it! Can you help me to choose a symbol that will be clear and can any easily represent 5 books? Mission Four: Work in pairs to find a symbol that could represent 5 books. Once you have agreed on a symbol, redraw the pictogram using your symbol for 5 books.
Mission Four: Work in pairs to find a symbol that could represent 5 books. Once you have agreed on a symbol, redraw the pictogram using your symbol for 5 books. Here’s the tally chart again to help you:
Mission Four: Work in pairs to find a symbol that could represent 5 books. Represents Five books Badgers Tigers MISSION FOUR COMPLETED Peacocks Elephants Pigs Spiders
Hi MI3 Me here. Well done!! Your pictograms are all fabulous, the only problem I now have is that I can’t choose the best because they are all so good!! Agent A Weed and Agent C Weed thank you all M MISSION COMPLETED
What difficulties are there with making pictograms? Which symbols to use? Ensuring that the symbols are the same size? choosing a symbol that is clear and can any easily represent the information?
Bar charts are a common way to display information Number of books read Reading Group