Download
1 / 11
2.08k likes | 5.65k Views
Data Handling. Simple Terms. MEAN OR AVERAGE MEAN=SUM OF OBSERVATIONS NO. OF OBSERVATIONS A CRICKETER SCORED FOLLOWING RUNS IN 5 INNINGS.WHAT IS HIS AVERAGE? 63,12,0,39,106 MEAN=63+12+0+39+106

E N D
Simple Terms • MEAN OR AVERAGE MEAN=SUM OF OBSERVATIONS NO. OF OBSERVATIONS A CRICKETER SCORED FOLLOWING RUNS IN 5 INNINGS.WHAT IS HIS AVERAGE? 63,12,0,39,106 MEAN=63+12+0+39+106 5 MEAN=220 5 MEAN= 44 RUNS
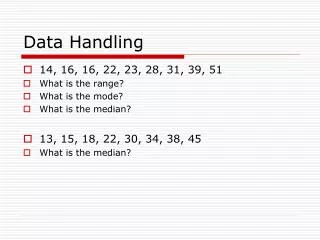
RANGE RANGE=HIGHEST OBSERVATION-LOWEST OBSERVATION A CRICKETER SCORED FOLLOWING RUNS IN 5 INNINGS.WHAT IS RANGEOF THE DATA? 63,12,0,39,106 RANGE= 106-0 = 106
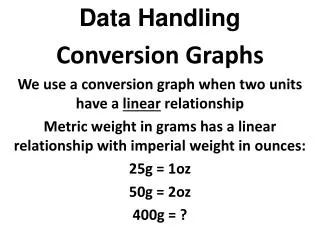
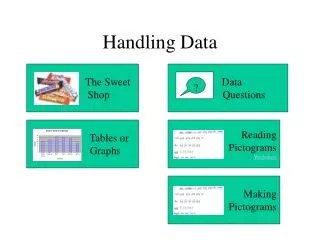
Usesof data handling Use of pictorial graphs makes the concept more clear and help us to understand the thing easily as compared to written text. 3 types of pictorial graphs used in data handling • Pictographs • Bar graphs • Tally marks
Pictographs A pictograph is a graph that shows numerical information by using picture symbols or icons to represent data sets. The advantage of using a pictograph is that it is easy to read. Points to be noted while making a pictograph • Pictograph should not be used in formal uses • You should ensure that you have mentioned scale • Pictures in the pictographs should be equal and simple to draw & resemble
A pictograph Pictures are equal and easy to draw & resemble It is easy to answer the questions Key or scale should be given
Bargraphs • Bar graph is a diagram in which the numerical values of variables are represented by the height or length of lines or rectangles of equal width. • Points to be noted while making a pictograph • The bars should be of equal width. • The scale should be given
A bar graph Bars are of equal width Scale should be given
Tally marks Tally marks, or hash marks, are a unary numeral system. They are a form of numeral used for counting. They allow updating written intermediate results without erasing or discarding anything written down. Tally marks used in most Tally marks used in china,japan,korea and taiwan Tally marks used in france, spain, South America
Thank you Made by- ShreyChhabra Class-VII-C