Download
1 / 194
1.95k likes | 2.12k Views
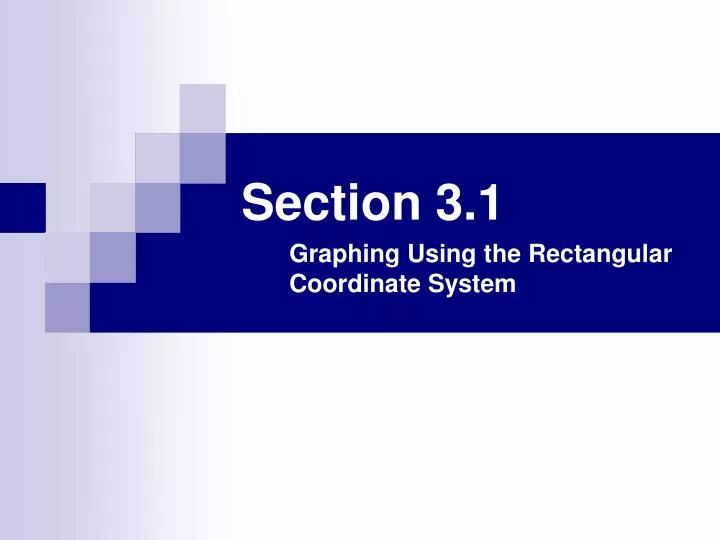
Section 3.1. Graphing Using the Rectangular Coordinate System. Objectives. Construct a rectangular coordinate system Plot ordered pairs and determine the coordinates of a point Graph paired data Read line graphs. Objective 1: Construct a Rectangular Coordinate System.

E N D
Section 3.1 Graphing Using the Rectangular Coordinate System
Objectives • Construct a rectangular coordinate system • Plot ordered pairs and determine the coordinates of a point • Graph paired data • Read line graphs
Objective 1: Construct a Rectangular Coordinate System • When designing the Gateway Arch in St. Louis, architects created a mathematical model called a rectangular coordinate graph. • This graph, shown here, is drawn on a grid called a rectangular coordinate system. • This coordinate system is also called a Cartesian coordinate system, after the 17th-century French mathematician René Descartes.
Objective 1: Construct a Rectangular Coordinate System • A rectangular coordinate system is formed by two perpendicular number lines. • The horizontal number line is usually called the x-axis, and the vertical number line is usually called the y-axis. • On the x-axis, the positive direction is to the right. On the y-axis, the positive direction is upward. • Each axis should be scaled to fit the data. For example, the axes of the graph of the arch are scaled in units of 100 feet. • The point where the axes intersect is called the origin. This is the zero point on each axis. • The axes form a coordinate plane, and they divide it into four regions called quadrants, which are numbered counterclockwise using Roman numerals.
Objective 1: Construct a Rectangular Coordinate System • Each point in a coordinate plane can be identified by an ordered pair of real numbers x and y written in the form (x, y). • The first number, x, in the pair is called the x-coordinate, and the second number, y, is called the y-coordinate. Read as “the point three, negative four” or as “the ordered pair three, negative four.”
Objective 2: Plot Ordered Pairs and Determine the Coordinates of a Point • The process of locating a point in the coordinate plane is called graphing or plotting the point. • In the figure seen here, we use blue arrows to show how to graph the point with coordinates (3, −4). • Since the x-coordinate, 3, is positive, we start at the origin and move 3 units to the right along the x-axis. • Since the y-coordinate, −4, is negative, we then move down 4 units and draw a dot. • This locates the point (3, −4).
Objective 2: Plot Ordered Pairs and Determine the Coordinates of a Point • In the figure, red arrows are used to show how to plot the point (−4, 3). • We start at the origin, move 4 units to the left along the x-axis, then move up 3 units and draw a dot. This locates the point (−4, 3).
EXAMPLE 1 • Plot each point. Then state the quadrant in which it lies or the axis on which it lies. a.(4, 4), b. (−1, −7/2), c. (0, 2.5), d. (−3, 0), e. (0, 0) Strategy After identifying the x- and y-coordinates of the ordered pair, we will move the corresponding number of units left, right, up, or down to locate the point. Why The coordinates of a point determine its location on the coordinate plane.
EXAMPLE 1 Solution a. Since the x-coordinate, 4, is positive, we start at the origin and move 4 units to the right along the x-axis. Since the y-coordinate, 4, is positive, we then move up 4 units and draw a dot. This locates the point (4, 4). The point lies in quadrant I. b. To plot (−1, −7/2), we begin at the origin and move 1 unit to the left, because the x-coordinate is −1. Then, since the y-coordinate is negative, we move 7/2 units, or 3½ units, down. The point lies in quadrant III.
EXAMPLE 1 Solution c. To plot (0, 2.5), we begin at the origin and do not move right or left, because the x-coordinate is 0. Since the y-coordinate is positive, we move 2.5 units up. The point lies on the y-axis. d. To plot (−3, 0), we begin at the origin and move 3 units to the left, because the x-coordinate is −3. Since the y-coordinate is 0, we do not move up or down. The point lies on the x-axis. e. To plot (0, 0), we begin at the origin, and we remain there because both coordinates are 0. The point with coordinates (0, 0) is the origin.
Objective 3: Graph Paired Data • Every day, we deal with quantities that are related: • The time it takes to cook a roast depends on the weight of the roast. • The money we earn depends on the number of hours we work. • The sales tax that we pay depends on the price of the item purchased. • We can use graphs to visualize such relationships. For example, suppose a tub is filling with water, as shown below. • Obviously, the amount of water in the tub depends on how long the water has been running. • To graph this relationship, we can use the measurements that were taken as the tub began to fill.
Objective 3: Graph Paired Data • The data in each row of the table can be written as an ordered pair and plotted on a rectangular coordinate system. • Since the first coordinate of each ordered pair is a time, we label the x-axis Time (min). The second coordinate is an amount of water, so we label the y-axis Amount of water (gal). • The y-axis is scaled in larger units (multiples of 4 gallons) because the size of the data ranges from 0 to 32 gallons.
Objective 3: Graph Paired Data • After plotting the ordered pairs, we use a straightedge to draw a line through the points. • As expected, the completed graph shows that the amount of water in the tub increases steadily as the water is allowed to run.
Objective 3: Graph Paired Data • We can use the graph to determine the amount of water in the tub at various times. • For example, the green dashed line on the graph shows that in 2 minutes, the tub will contain 16 gallons of water. • This process, called interpolation, uses known information to predict values that are not known but are within the range of the data. • The blue dashed line on the graph shows that in 5 minutes, the tub will contain 40 gallons of water. • This process, called extrapolation, uses known information to predict values that are not known and are outside the range of the data.
Objective 4: Read Line Graphs • Since graphs are a popular way to present information, the ability to read and interpret them is very important.
EXAMPLE 3 TV Shows • The following graph shows the number of people in an audience before, during, and after the taping of a television show. Use the graph to answer the following questions. a. How many people were in the audience when the taping began? b. At what times were there exactly 100 people in the audience? c. How long did it take the audience to leave after the taping ended?
EXAMPLE 3 TV Shows Strategy We will use an ordered pair of the form (time, size of audience) to describe each situation mentioned in parts (a), (b), and (c). Why The coordinates of specific points on the graph can be used to answer each of these questions.
EXAMPLE 3 TV Shows Solution a. The time when the taping began is represented by 0 on the x-axis. The point on the graph directly above 0 is (0, 200). The y-coordinate indicates that 200 people were in the audience when the taping began. b. We can draw a horizontal line passing through 100 on the y-axis. Since the line intersects the graph twice, at (−20, 100) and at (80, 100), there are two times when 100 people were in the audience. The x-coordinates of the points tell us those times: 20 minutes before the taping began, and 80 minutes after. c. The x-coordinate of the point (70, 200) tells us when the audience began to leave. The x-coordinate of (90, 0) tells when the exiting was completed. Subtracting the x-coordinates, we see that it took 90 − 70 = 20 minutes for the audience to leave.
Section 3.2 Graphing Linear Equations
Objectives • Determine whether an ordered pair is a solution of an equation • Complete ordered-pair solutions of equations • Construct a table of solutions • Graph linear equations by plotting points • Use graphs of linear equations to solve applied problems
Objective 1: Determine Whether an Ordered Pair Is a Solution of an Equation • We have previously solved equations in one variable. • For example, x + 3 = 9 is an equation in x. • If we subtract 3 from both sides, we see that 6 is the solution. To verify this, we replace x with 6 and note that the result is a true statement: 9 = 9. • In this chapter, we extend our equation-solving skills to find solutions of equations in two variables. • To begin, let’s consider y = x− 1, an equation in x and y. • A solution of y = x− 1 is a pair of values, one for x and one for y, that make the equation true. To illustrate, suppose x is 5 and y is 4. Then we have:
Objective 1: Determine Whether an Ordered Pair Is a Solution of an Equation • Since the result is a true statement, x = 5 and y = 4 is a solution of y = x− 1. • We write the solution as the ordered pair (5, 4), with the value of x listed first. • We say that (5, 4) satisfiesthe equation. • In general, a solution of an equation in two variables is an ordered pair of numbers that makes the equation a true statement.
EXAMPLE 1 • Is (−1, −3) a solution of y = x− 1? Strategy We will substitute −1 for x and −3 for y and see whether the resulting equation is true. Why An ordered pair is a solutionof y = x − 1if replacing the variables with the values of the ordered pair results in a true statement.
EXAMPLE 1 Solution Conclusion: Since −3 = −2 is false, (−1, −3) is not a solution of y = x − 1.
Objective 2: Complete Ordered-Pair Solutions of Equations • If only one of the values of an ordered-pair solution is known, we can substitute it into the equation to determine the other value.
EXAMPLE 2 • Complete the solution (−5, ) of the equation y = –2x + 3. Strategy We will substitute the known x-coordinate of the solution into the given equation. Why We can use the resulting equation in one variable to find the unknown y-coordinate of the solution.
EXAMPLE 2 Solution In the ordered pair (−5, ), the x-value is −5; the y-value is not known. To find y, we substitute −5 for x in the equation and evaluate the right side. The completed ordered pair is (−5, 13).
Objective 3: Construct a Table of Solutions • To find a solution of an equation in two variables, we can select a number, substitute it for one of the variables, and find the corresponding value of the other variable. • For example, to find a solution of y = x− 1, we can select a value for x, say, −4, substitute −4 for x in the equation, and find y.
Objective 4: Graph Linear Equations by Plotting Points • It is impossible to list the infinitely many solutions of the equation y = x− 1. • However, to show all of its solutions, we can draw a mathematical “picture” of them. We call this picture the graph of the equation. • To graph y = x− 1, we plot the ordered pairs shown in the table on a rectangular coordinate system. • Then we draw a straight line through the points, because the graph of any solution of y = x− 1 will lie on this line. • We also draw arrowheads on either end of the line to indicatethat the solutions continue indefinitely in both directions,beyond what we can see on the coordinate grid. • We call the line the graph of the equation. It represents all of the solutions of y =x − 1.
Objective 4: Graph Linear Equations by Plotting Points • The equation y = x− 1 is said to be linear and its graph is a line. • By definition, a linear equation in two variables is any equation that can be written in the following form,where the variable terms appears on one side of an equal symbol and a constant appears on the other. • A linear equation in two variables is an equation that can be written in the form Ax + By = C, where A, B, and C are real numbers and A and B are not both 0. This form is called standard form.
Objective 4: Graph Linear Equations by Plotting Points • Linear equations can be graphed in several ways. Generally, the form in which an equation is written determines the method that we use to graph it. To graph linear equations solved for y, such as y = 2x + 4, we can use the following point-plotting method. • Graphing Linear Equations Solved for y by Plotting Points: 1. Find three ordered pairs that are solutions of the equation by selecting three values for x and calculating the corresponding values of y. 2. Plot the solutions on a rectangular coordinate system. 3. Draw a straight line passing through the points. If the points do not lie on a line, check your calculations.
EXAMPLE 4 • Graph y = 2x + 4. Strategy We will find three solutions of the equation, plot them on a rectangular coordinate system, and then draw a straight line passing through the points. Why To graph a linear equation in two variables means to make a drawing that represents all of its solutions.
EXAMPLE 4 Solution To find three solutions of this linear equation, we select three values for x that will make the computations easy. Then we find each corresponding value of y.
EXAMPLE 4 Solution We enter the results in a table of solutions and plot the points. Then we draw a straight line through the points and label it y = 2x + 4.
As a check, we can pick two points that the line appears to pass through, such as (1, 6) and (−1, 2). When we substitute their coordinates into the given equation, the two true statements that result indicate that (1, 6) and (−1, 2) are solutions and that the graph of the line is correctly drawn. EXAMPLE 4 Solution
Objective 5: Use Graphs of Linear Equations to Solve Applied Problems • When linear equations are used to model real-life situations, they are often written in variables other than x and y. • In such cases, we must make the appropriate changes when labeling the table of solutions and the graph of the equation.
EXAMPLE 7 Cleaning Windows • The linear equation A = −0.03n + 32 estimates the amount A of glass-cleaning solution (in ounces) that is left in the bottle after the sprayer trigger has been pulled a total of n times. Graph the equation and use the graph to estimate the amount of solution that is left after 500 sprays. Strategy We will find three solutions of the equation, plot them on a rectangular coordinate system, and then draw a straight line passing through the points. Why We can use the graph to estimate the amount of solution left after any number of sprays.
EXAMPLE 7 Cleaning Windows Solution Since A depends on n in the equation A = −0.03n + 32, solutions will have the form (n, A). To find three solutions, we begin by selecting three values of n. Because the number of sprays cannot be negative, and the computations to find A involve decimal multiplication, we select 0, 100, and 1,000. For example, if n = 100, we have Thus, (100, 29) is a solution. It indicates that after 100 sprays, 29 ounces of cleaner will be left in the bottle.
EXAMPLE 7 Cleaning Windows Solution In the same way, solutions are found for n = 0 and n = 1000 and listed in the table. Then the ordered pairs are plotted and a straight line is drawn through the points. To graphically estimate the amount of solution that is left after 500 sprays, we draw the dashed blue lines, as shown. Reading on the vertical A-axis, we see that after 500 sprays, about 17 ounces of glass cleaning solution would be left.
Section 3.3 Intercepts
Objectives • Identify intercepts of a graph • Graph linear equations by finding intercepts • Identify and graph horizontal and vertical lines • Obtain information from intercepts
Objective 1: Identify Intercepts of a Graph • The graph of y = 2x− 4 is shown below. • We see that the graph crosses the x-axis at the point (0, −4); this point is called the y-intercept of the graph. • The graph crosses the x-axis at the point (2, 0); this point is called the x-intercept of the graph.
EXAMPLE 1 • For the graphs in figures (a) and (b), give the coordinates of the x- and y-intercepts. Strategy We will determine where each graph (shown in red) crosses the x-axis and the y-axis. Why The point at which a graph crosses the x-axis is the x-intercept and the point at which a graph crosses the y-axis is the y-intercept.
EXAMPLE 1 Solution a. In figure (a), the graph crosses the x-axis at (−4, 0). This is the x-intercept. The graph crosses the y-axis at (0, 1). This is the y-intercept. b. In figure (b), the horizontal line does not cross the x-axis; there is no x-intercept. The graph crosses the y-axis at (0, −2). This is the y-intercept.
Objective 1: Identify Intercepts of a Graph • From the previous examples, we see that a y-intercept has an x-coordinate of 0, and an x-intercept has a y-coordinate of 0. • These observations suggest the following procedures for finding the intercepts of a graph from its equation. • Finding Intercepts: To find the y-intercept, substitute 0 for x in the given equation and solve for y. To find the x-intercept, substitute 0 for y in the given equation and solve for x.
Objective 2: Graph Linear Equations by Finding Intercepts • Plotting the x- and y-intercepts of a graph and drawing a line through them is called the intercept method of graphing a line. • This method is useful when graphing linear equations written in the standard (general) form Ax + By = C. • The calculations for finding intercepts can be simplified if we realize what occurs when we substitute 0 for y or 0 for x in an equation written in the form Ax + By = C.
EXAMPLE 4 • Graph 3x = −5y + 8 by finding the intercepts. Strategy We will let x = 0 to find the y-intercept of the graph. We will then let y = 0 to find the x-intercept. Why Since two points determine a line, the y-intercept and x-intercept are enough information to graph this linear equation.
EXAMPLE 4 We find the intercepts and select x = 1 to find a check point. Solution
EXAMPLE 4 Solution The ordered pairs are plotted as shown, and a straight line is then drawn through them.