Download
1 / 14
140 likes | 219 Views
Section 3.1. Reading Graphs Plotting Points Scaling Graphs. Circle Graphs/ Pie Charts. If there are 300,000,000 Americans, how many bought new clothes this week?. Bar Graph. How many drinks would a 140-pound person need to consume in 1 hour to reach the legal limit?

E N D
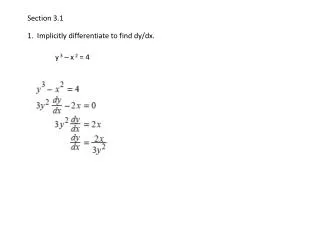
Section 3.1 Reading Graphs Plotting Points Scaling Graphs
Circle Graphs/ Pie Charts If there are 300,000,000 Americans, how many bought new clothes this week?
Bar Graph How many drinks would a 140-pound person need to consume in 1 hour to reach the legal limit? (DISCLAIMER: This is a VERY rough estimate and does not take many factors into account)
Line Graph If I like to surf 5-foot waves, about what time should I go to the beach?
Points and Ordered Pairs origin x-axis y-axis The line and bar graphs have two axes, a horizontal axis and a vertical axis. Axes are perpendicular lines that cross at a point called the origin.
Points and Ordered Pairs • Consider the ordered pair (2, 3). It is “ordered” because the order of the numbers matters. • The numbers are called coordinates. • An ordered pair represents a point we can graph using our axes: • Start at the origin. • Move horizontally first (2 to the right). • Move vertically second (3 up). • Make a dot. This point represents the ordered pair (2, 3).
Points and Ordered Pairs • On your graph, plot the points • (2, 3) • (0, 0) • (3, 2) • (-2, 1) • (2, -1) • What are the coordinates of A?
Quadrants (-, +) (+, +) II I A point on an axis is not in either quadrant. IV III (+, -) (-, -)
Scaling Axes Consider the points (-34, 450), (48, 95), and (10, -200). To decide how to draw and label your axes, consider the smallest and largest value you will need to have on each axis.
With your partner(s) Now we will look at scatterplots, graphs were many points are plotted together. Work on Questions 1 and 2 of your Quiz Handout. Work on Questions 3 and 4. Work on Question 5.
Linear vs. Nonlinear Trends Some relationships between the measurements can be summarized well by a line. Do Questions 7 and 8.
Strong vs. Weak Relationships If a relationship is strong, the line or curve does a good job summarizing the relationship between the measurements. This means there is less scatter in the data about the line or curve. Do Question 9.
Positive vs. Negative Linear Relationships • A linear relationship has direction. • When a linear relationship is positive: • smaller values of xtend to correspond to smaller values of y • larger values of xtend to correspond to larger values of y • When a linear relationship is negative: • smaller values of xtend to correspond to larger values of y • larger values of xtend to correspond to smaller values of y • Answer Questions 10 and 11.
Direction of a Linear Relationship In Section 3.2 we will begin to learn how to graph these straight lines we were sketching in this activity. The direction of a linear relationship is an important concept for when we begin to discuss the slopeof the lines we are graphing.