Download

1 / 12
120 likes | 256 Views
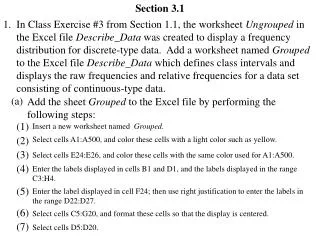
Section 3.1. Introduction to Graphing. Page 160. The Rectangular Coordinate System. One common way to graph data is to use the rectangular coordinate system, or xy- plane . In the xy -plane the horizontal axis is the x -axis , and the vertical axis is the y -axis.

E N D
Section 3.1 • Introduction to Graphing
Page 160 The Rectangular Coordinate System • One common way to graph data is to use the rectangular coordinate system, or xy-plane. • In the xy-plane the horizontal axis is the x-axis, and the vertical axis is the y-axis. • The axes intersect at the origin. • The axes divide the xy-plane into four • regions called quadrants, which are • numbered I, II, III, and IV • counterclockwise
Example Page 161 • Plot the following ordered pairs on the same xy-plane. State the quadrant in which each point is located, if possible. a. (4, 3) b. (3, 4) c. (1, 0) • Solution • a. (4, 3) Move 4 units to the right of the origin and 3 units up. • b. (3, 4)Move 3 units to the left of the origin and 4 units down. • c. (1, 0)Move 1 unit to the left of the origin. Quadrant I Quadrant III Not in any quadrant
Example Page 161 • Frozen pizza makers have improved their pizzas to taste more like homemade. Use the graph to estimate frozen pizza sales in 1994 and 2000. • Solution • a. To estimate sales in 1994, locate 1994 on the x-axis. Then move upward to the data point and approximate its y-coordinate. • about $2.1 billion in sales
Example (cont) Page 161 • Frozen pizza makers have improved their pizzas to taste more like homemade. Use the graph to estimate frozen pizza sales in 1994 and 2000. • Solution • b. To estimate sales in 2000, locate 2000 on the x-axis. Then move upward to the data point and approximate its y-coordinate. • about $3.0 billion in sales
Page 162 Scatterplots and Line Graphs • If distinct points are plotted in the xy-plane, then the resulting graph is called a scatterplot.
Example Page 162 • Make a scatterplot of the data in the following table, which lists the price of a first-class postage stamp for selected years.
Page 163 Line Graphs Sometimes it is helpful to connect consecutive data points in a scatterplot with line segments. This creates a line graph.
Example Page 163 • Use the data in the table to make a line graph. • Solution • Plot the points and then connect consecutive points with line segments.
Example Page 164 • Use the figure to answer the questions. • a. Which 10-year period had the greatest increase in energy consumption? • 1970 to 1980 • b. Estimate the energy consumption in 2010. • About 310 million Btu
Objectives • Tables and Graphs • The Rectangular Coordinate System • Scatterplots and Line Graphs